
China's top-performing mutual fund in 2019 delivered a staggering 121.69% return for the year.
And it wasn't alone. Across a competitive field of over 2,200 equity and hybrid funds, the average return for ordinary equity funds hit 47.33%, while equity-oriented hybrid funds averaged 44.96%.
This collective performance not only beat the vast majority of retail investors but also outpaced all major market indices, including the ChiNext.
It's no surprise, then, that 2020 began with a wave of blockbuster new fund launches, as capital flooded back into the long-dormant mutual fund sector.
Yet beneath this surface prosperity lie critical questions for investors. What truly drove the exceptional 2019 fund performance? Was it the broader market rally, specific investment styles, or genuine stock-picking skill by fund managers?
More importantly, after such a stellar "year of the fund," can this level of returns be sustained? And which funds should investors consider now?
To answer these questions, the GF Securities Fund Research Team applied quantitative models to dissect fund performance and identify the most promising equity funds for 2020.
How do we measure exactly what kind of returns a fund generates?
Following a subdued 2018, the A-share market rebounded in the first half of 2019, entering a broad-based bull run. The second half saw frequent thematic rotations, creating a structural bull market where all major indices finished in positive territory.
This environment provided fertile ground for actively managed funds to generate alpha.
In 2019, the average cumulative returns for equity and hybrid funds were 45.18% and 34.48%, respectively. By comparison, the Shanghai 50, CSI 300, CSI 500, ChiNext Index, and SME Board Index rose 40.99%, 36.07%, 27.51%, 43.79%, and 41.03%.
The fact that the average equity fund outperformed all benchmark indices is a rare historical feat.
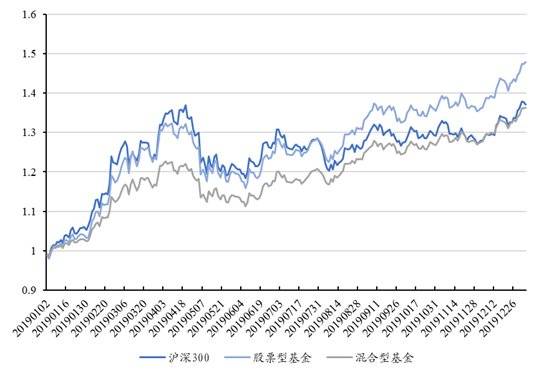
2019 Returns of Equity and Hybrid Funds. Source: GF Securities Research, Wind
In absolute terms, the mutual fund industry delivered outstanding results in 2019, with top performers even doubling their net asset value (NAV) within the year.
The key question for investors now is whether this strong performance can continue.
To find out, we need to perform a performance attribution analysis on the fund. This will clarify where its returns came from—whether they were driven by broad market movements (beta), a specific investment style, or the fund manager's skill in selecting stocks.
Only by pinpointing the true source of returns can we gauge the sustainability of the fund's future performance.
We start by applying the enhanced Fama-French three-factor model proposed by Andelidis et al. (2013) to analyze the fund's return sources.
This model differs from the traditional three-factor model primarily by emphasizing the fund's own benchmark index as a critical component in performance attribution.
With the rise of thematic funds, benchmark-based evaluation has become increasingly important. For instance, a technology innovation fund might use the CSI TMT Industry Theme Index as its benchmark—an index that naturally has greater exposure to small-cap and growth stocks compared to the broader CSI 300 Index.
Therefore, applying the same factor model to all funds without accounting for their inherent differences will inevitably lead to biased results.
Has the core driver of fund performance changed?
Using quarterly aggregated daily return data for funds dating back to 2007, our performance attribution analysis shows a clear pattern. From 2013 to 2016, the dominant small-cap market style meant the size factor consistently delivered positive returns, while other factors struggled to provide stable performance.
Looking at fund alpha (excess returns), the historical average has hovered around zero. This indicates that, over the long term, mutual funds have generally failed to deliver consistent outperformance.
However, in the third and fourth quarters of 2019, average fund alpha was notably strong. This suggests fund managers demonstrated superior stock-picking ability in the latter half of 2019, generating returns that exceeded their benchmark portfolios.
A closer look at the relationship between fund alpha and raw returns across the four quarters of 2019 reveals significant shifts.
In Q1 2019, a broad market rally meant there was no clear correlation between alpha and raw fund returns. However, from Q1 through Q4, this correlation steadily strengthened.
By Q4, a clear linear relationship had emerged. In other words, fund managers' stock-picking ability (alpha) had become the decisive driver of performance.

The chart illustrates the relationship between fund Alpha and raw returns across the four quarters of 2019. Data source: Guotai Junan Securities Research, Wind.
These findings lead us to a key conclusion: in a structural market, a fund manager's stock-picking ability becomes the primary driver of performance.
The latter half of 2019 presented just such an environment—a structural bull market where high-quality companies across sectors thrived, offering fund managers the perfect stage to showcase their stock selection skills.
How can investors identify fund managers with consistent stock-picking ability?
Given its importance, the top priority for investors is to pinpoint which funds and managers possess this crucial skill.
Within a relative performance framework, a manager's decision to deviate from a benchmark portfolio reflects active investment choices, often based on proprietary insights.
Such deviations entail active risk. To measure this, Petajisto (2013) developed the "Active Share" metric, which quantifies the percentage of a fund's stock holdings that differ from its benchmark index.
Empirical research on U.S. actively managed funds from 1999 to 2009 found that a high Active Share significantly predicts future fund outperformance.
Calculating the average Active Share for China's equity and hybrid funds reveals that public mutual funds generally maintain high ratios—consistently above 80%—with a historical trend showing an initial increase followed by a gradual decline.

Time-series average Active Share of funds. Data source: Guotai Junan Securities Research, Wind.
We also analyzed the relationship between the Active Share of Chinese public mutual funds and their subsequent Alpha (excess returns) since 2011.
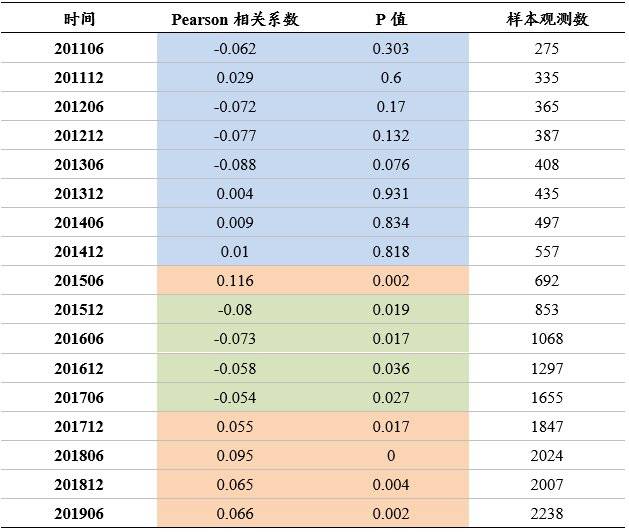
Correlation coefficient between Active Share and Alpha. Data source: Guotai Junan Securities Research, Wind.
The correlation between Active Share and excess returns for Chinese funds has shown dynamic variation over time.
Before 2015, there was no strong link between the two. But in the second half of 2015, a statistically significant *negative* correlation appeared between actively managed equity holdings and excess returns. This meant that the active risk funds took by deviating from their benchmarks wasn't paying off; instead, it was hurting their performance.
However, as China's public mutual fund industry evolved, this relationship flipped starting in late 2017. The correlation shifted from significantly negative to a statistically significant *positive* one.
This suggests a qualitative leap in fund managers' active management skills. Skilled stock-pickers were now able to add real value and boost investor returns through their active strategies.
We believe this shift is connected to the fading small-cap stock effect since 2017. Frequent market style rotations made it harder to identify persistent alpha factors, while increased competition allowed truly talented stock-pickers to shine.
To cross-check these findings, we identified funds whose Alpha ranked in the top 20% based on their mid-2019 holdings reports and analyzed the sector distribution of their active bets.
On average, these funds were most overweight in three China Securities (CITIC) Level-1 sectors: Electronics & Components, Computer Science, and Pharmaceuticals—precisely the sectors that performed strongly in the latter half of 2019.

Top-performing stock-picking funds overweight technology and pharmaceuticals sectors. Data Source: Guotai Junan Securities Research, Wind
In short, if Chinese active fund managers are indeed getting better at picking stocks, and if we expect another structural bull market ahead, investors should focus on managers who have already proven their stock-picking skill over the past two to three years—that is, since 2017.
Floating-fee products offer downside protection for active management
Within the active fund space, there's another potential tailwind that investors should watch closely.
At the end of 2019, floating-fee products made a comeback, following the CSRC's draft "Guidelines for Charging Floating Management Fees on Publicly Offered Securities Investment Funds." Based on their fee structures, these funds fall into two main categories:
First, "pivot-based" floating-fee funds, where fees move both up and down.
Here, the manager's fee is directly linked to the fund's performance: it rises when the fund beats its benchmark and falls when it underperforms.
Second, performance-fee-based floating-fee funds.
On top of a fixed management fee, fund managers also charge a performance fee on returns that exceed a predetermined benchmark.
According to the prospectuses from the six approved public mutual fund companies, all the new floating-fee products are structured as "performance fee" funds.
Specifically, the management fee has two parts: a relatively low, quasi-fixed annual rate of 0.8% (consistent across all these funds), and a performance fee. The latter charges 20% on the portion of returns exceeding an annualized 8% benchmark, calculated based on the amount of shares redeemed.
Since all current floating-fee products are hybrid funds, and comparable products typically charge a fixed 1.5% annual fee, managers need to achieve a 12% annualized return just to match their previous fixed-fee revenue. Only returns above 12% generate additional performance fees.
Floating management fees are designed as a powerful incentive, allowing managers to earn more for superior performance. The mechanism aims to optimize the principal-agent relationship by better aligning the interests of fund managers and investors.
However, whether this model truly benefits investors is still up for debate.
From a behavioral perspective, academics have long discussed the asymmetry between fund inflows and performance—specifically, how it can encourage managers to take on excessive risk.
This happens because strong performance attracts far more capital than equivalent underperformance drives away. Facing this skewed reward system, managers might be tempted to chase excessive risk or engage in short-term "style drift," which can ultimately hurt investors or deviate from the fund's stated strategy.
The performance-based fee model could intensify this asymmetry, raising concerns that it might encourage even greater risk-taking.
Notably, the newly launched products address this by imposing minimum holding periods, which extends the manager's performance evaluation horizon. This helps reduce pressure from short-term rankings and the associated risk-taking incentives, allowing managers to focus on executing their strategy for long-term growth.
Furthermore, as the first batch of products approved after the resumption, both the funds and their managers represent a curated selection by the fund companies. Knowing their track records will be closely watched, managers have relatively limited incentive for short-term gambles.
After accounting for performance fees, whether actively managed funds offer good value depends heavily on market conditions. In bear or volatile markets, active A-share funds often outperform relevant indices and generate alpha. In bull markets, however, they frequently lose their edge.
We analyzed the performance of equity and hybrid funds in China's A-share market since 2010, alongside five major broad-market indices. By comparing the median fund performance against representative indices, we can see how the relative advantage of active versus passive management shifts across different market environments.
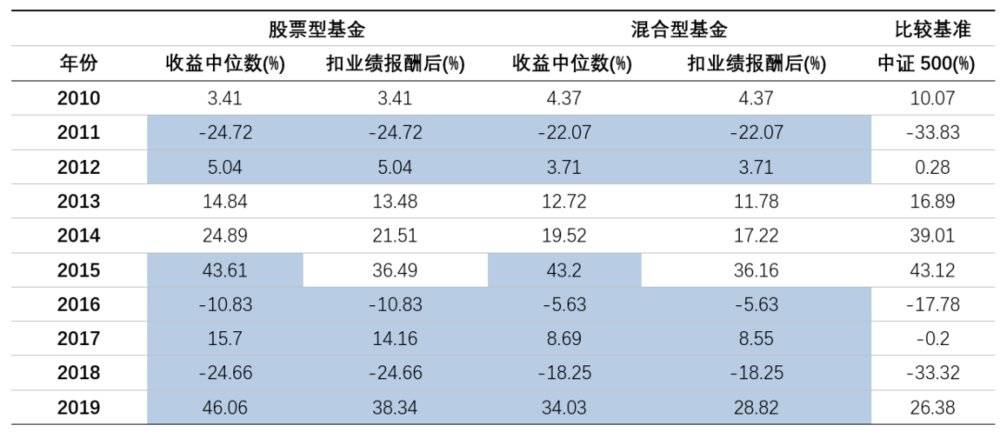
Floating fees significantly impacted relative fund returns during the 2015 bull market. Data source: Guotai Junan Securities Research, Wind
According to the performance fee calculation method for the floating management fee fund declared in this filing, a 20% performance fee is charged on returns exceeding the fixed annualized 8% threshold. Each year, we calculate the post-fee returns for the median-performing fund using this methodology.
It is evident that during bear markets and sideways markets—when index performance is relatively weak—the majority of actively managed funds generate alpha relative to the benchmark index. Moreover, since returns often fail to reach the annualized 8% threshold, no performance fee is levied, and the lower management fee further enhances net fund returns.
In contrast, during bull markets such as 2014 and 2015—when index performance was exceptionally strong—the majority of actively managed funds underperformed the index. In such cases, the performance fee further widens the performance gap between actively managed funds and the benchmark index.
Using this simplified scenario analysis, overall, the vast majority of actively managed funds in China’s A-share market outperform their benchmarks and generate excess returns. The floating management fee helps investors save on management fees during bear markets but also reduces net returns during bull markets; in sideways markets, fund performance becomes more dependent on the fund manager’s skill.
From the fund company’s perspective, they prefer launching floating-fee products near market bottoms to fully capture upside gains during subsequent market rallies.