
Compiled by: DeFi Way
This week, we're sharing our perspective on valuation frameworks for Layer-1 blockchains, with a focus on Ethereum. Here's what we'll cover:
Tokens as tools for capital formation
How ETH fits into the "super asset class" framework
On-chain finance and discounted cash flow (DCF) analysis
ETH as a digital commodity and store of value
Our favorite KPIs to monitor
Why Tokens Matter
We've covered token fundamentals in detail before. If you're interested, you can dive deeper with our Tokenomics 101 guide.
To set the stage, let's quickly recap why tokens are such a powerful tool for bootstrapping projects and forming capital. If you're already familiar with this, feel free to skip ahead.
In short, tokens are most useful when you need to create permissionless incentives for specific behaviors across a broad, public network. They help coordinate activity toward a shared, expansive, and decentralized goal.
Take Ethereum: its goal is to build a "world computer" or open data network that enables new internet-native business models through smart contracts, peer-to-peer interactions, and user-controlled data.
To bootstrap this vision in a truly open-source way—with no single entity controlling access or editing rights—Ethereum issued a token. Inspired by Bitcoin's success, the blockchain was programmed to reward early contributors. This created the necessary incentives to coordinate a global network of individual contributors and service providers: developers, validators, node operators, and miners.
The Super Asset Class Framework
In traditional finance, financial assets are typically grouped into three super asset classes:
1. Capital Assets: These generate cash flows directly. Think bonds, real estate, and equities.
2. Consumable/Transformable Assets: These can be consumed or transformed. They have economic value but don't generate cash flows directly. Examples include commodities like corn, oil, or precious metals.
3. Stores of Value / Monetary Assets: These provide no income and can't be consumed or transformed. Examples are fiat currencies, precious metals (with a monetary premium), artworks, and collectibles.
So where does a Layer-1 cryptoasset like ETH fit? Interestingly, ETH exhibits traits from all three categories.
Capital Asset: Ethereum generates cash flow—collected by validators and block producers through user transactions. However, to earn this yield, you must hold and stake the native token in smart contracts.
*Note: Simply holding ETH doesn't generate yield, unlike dividend stocks or bonds. You need to stake your ETH—actively validating transactions and providing network services—to earn rewards.
Consumable/Transformable Asset: Ethereum also has commodity-like properties. As more users join the network, ETH gets "consumed." This happens through a burn mechanism, which functions like an automatic stock buyback triggered by rising demand for block space. Just as gasoline powers vehicles, ETH is required to interact with the Ethereum database—or any application built on it. Roughly 70–85% of the ETH paid in transaction fees is burned and permanently removed from circulation. That's why some call ETH "digital oil"—it acts as a digital commodity.
Store of Value / Monetary Asset: The value of monetary assets depends on exchange rates and market sentiment. For example, if people expect high U.S. inflation, they might prefer gold over USD. If they see the U.S. economy as stable, they might hold USD instead of EUR.
Similarly, people hold collectibles or art based on perceived value. Stores of value generally require uniqueness and scarcity. Given that Ethereum's utility is expected to grow over time—while ETH's supply decreases—many view ETH as a store of value.
On-Chain Finance
Ethereum's core product is block space. Demand for it comes from the entire ecosystem built on and around the blockchain: developers, nodes, validators, oracles, users, and enterprises. Its open database, combined with smart contracts, enables peer-to-peer interactions and novel, internet-native business models.
Want to borrow on Aave or trade on Uniswap? You'll need block space. Minting an NFT? Sending USDC to family? Playing an Ethereum-based game? All require block space.
Every transaction—even recording non-financial data—requires paying for block space. And users pay with ETH. Think of Ethereum as a technology platform, similar to Amazon or Apple's iPhone. Beyond selling hardware, Apple generates revenue by letting developers build and distribute apps through the App Store. Similarly, if developers build compelling businesses on Ethereum that users adopt, the underlying cryptoasset—ETH—should capture economic value.
Let's break this down with a simple on-chain financial statement:

Data: Token Terminal
Fee Revenue: The total dollar value of block space sold during a period.
Cost of Revenue: The dollar value of fees paid to service providers (validators). Last year, about 15% of fees went to validators, equating to a yield of roughly 5.1%.
Gross Profit: Total fees minus payments to validators. This also represents the total dollar amount of ETH burned—which we can think of as a share buyback, benefiting passive ETH holders. More on this next.
Operating Expenses: This represents the dollar value of the block subsidy (or protocol inflation) distributed to global validators. Think of it as Ethereum's security budget, which plummeted by 90% after the Merge. *A quick note: the blockchain isn't literally "paying" this out. A better analogy is a startup issuing new equity, which dilutes existing shareholders.
Net Income: This is gross profit minus operating expenses. It calculates the portion of total network fee revenue left after covering the block subsidy paid to validators. A positive figure means more ETH is being burned (from transaction fees) than is being issued to pay for network security.
Important Note: There's no theoretical cap on how much ETH can be burned, as it's directly linked to transaction volume. More transactions (i.e., higher demand for block space) means more ETH is permanently removed from circulation. However, the amount of new ETH issued is capped. It's guided by the Ethereum Foundation and depends on the total ETH staked in validator contracts. With 13.8% of circulating ETH currently staked, the network's inflation rate is about 1,700 ETH per day.
The protocol mints new ETH to pay validators for processing transactions and securing the network—these are the operating expenses or token incentives. As long as the demand for block space generates more fee revenue than this security budget, the network is profitable—because the circulating supply shrinks (benefiting passive holders). Meanwhile, validators (active participants) earn substantial income from transaction fees.
This was precisely the case last quarter, even during a deep crypto bear market. Looking at the P&L statement, you might wonder why the network appeared less profitable over the past 6 to 12 months.
We attribute this shift in profitability to the Merge on September 16. The chart below shows ETH's net issuance since that event.
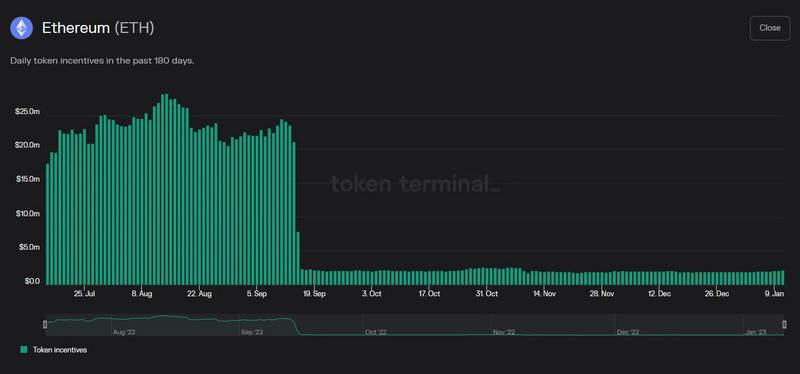
Source: Token Terminal
Simply put, the Ethereum Foundation was overpaying its miners! This chart makes that clear. As mentioned, after switching to Proof-of-Stake (PoS), Ethereum slashed its security expenses by roughly 90%.
Capital Asset Valuation
Given ETH's speculative nature and volatility—both in price and utility—we ran two separate discounted cash flow (DCF) models.
a. Using 2022's total transaction fees, with a 25% annual growth rate, a 12% discount rate, and a 20-year horizon. This yields a $416 billion market cap, or $3,459 per fully diluted token. Remember, these are bear-market figures, as fees dropped 58% year-over-year from 2021. Here is a simple DCF calculation.
b. Using 2021's total transaction fees, with the same 25% annual growth rate. Holding all other assumptions constant, we get a $966 billion market cap, or $8,022 per token. This gives us a bull-market valuation perspective. Here is a simple DCF calculation.
Ethereum has the potential to become a global financial settlement layer, with numerous other applications. Its addressable market is vast. From this viewpoint, a $1 trillion market cap seems reasonable.
Note that we used a conservative 25% annual fee growth rate. Over the past five years, Ethereum's fee revenue actually grew at a 146% compound annual growth rate (CAGR), even including the 58% drop in 2022.
Treat these calculations as a starting point for valuation, not investment advice. The time horizon, discount rate, and growth rate can be adjusted for different scenarios. Basing the model solely on total transaction fees also has its limitations. Finally, separate analyses might be needed for passive ETH holders (non-stakers) versus stakers/validators.
Revenue/Earnings Multiples
As a decentralized network, Ethereum's expenses are borne by its distributed validators. These expenses are essentially the cost of staking—the dollar value of the staked ETH. As noted in the on-chain financials, network expenses can also be seen as protocol inflation, paid to incentivize validators. Some analysts view these as decentralized costs and exclude them from earnings multiple or DCF analyses, treating total revenue as earnings.
From this angle, applying multiples to recent annual revenue and comparing to today's market cap gives us:
2021: 17x revenue multiple (price-to-sales ratio)
2022: 41x revenue multiple (price-to-sales ratio)
These multiples look attractive, especially when compared to high-growth tech companies that often trade at even higher valuations. Tesla is an extreme example, trading at over 200x P/E during the 2021 bull market. Amazon currently trades at an 86x P/E, down 45% from its peak share price.
Daily Flow
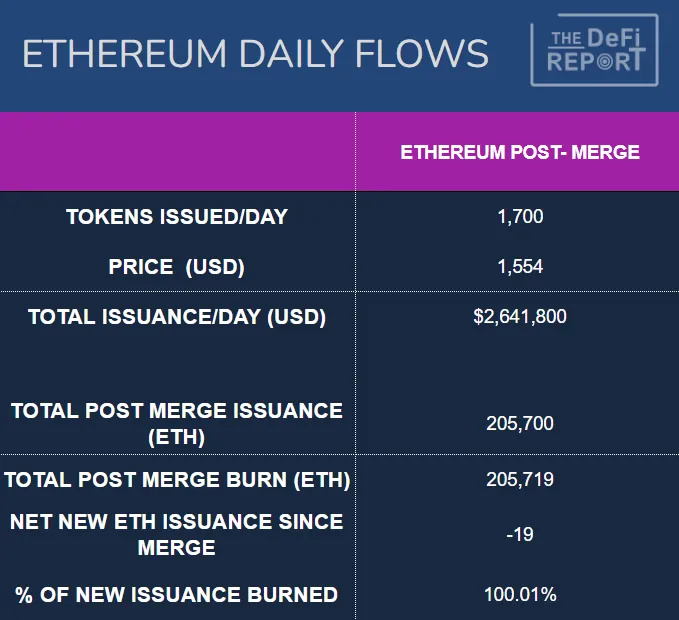
Data: Etherscan
The chart above covers the period from 9/16/22 to 1/15/23, post-Merge. It highlights the dramatic shift in network flow. Before the Merge, when the network was overpaying miners, it minted ~13,500 new ETH daily. At today's price, that's ~$20.9 million in new supply hitting the market each day. Miners also had operational costs (hardware + electricity), forcing them to sell roughly 80% of their rewards.
Post-Merge, we now mint only ~1,700 new ETH daily—a nearly 90% reduction! This number varies slightly with the total amount of ETH staked. Crucially, validators have minimal operational expenses. Therefore, the automatic sell pressure from that 80% of new supply has vanished.
Furthermore, 18 million ETH are locked in DeFi applications. Adding this to the 16 million ETH staked in validator contracts means roughly 28% of the circulating supply is locked in smart contracts and earning yield. We can think of this as "non-liquid circulating supply."
Key Takeaway: Before the Merge, the market had to absorb ~$16 million in guaranteed daily sell pressure. That pressure is now mostly gone. In fact, on days when more ETH is burned than issued, structural "capital outflows" would be needed to prevent the price from rising. We're still in a bear market, but a quick look at Etherscan shows that 11 of the first 14 days in 2023 saw net deflationary ETH issuance.
We can see this shift reflected in recent market flows. Ethereum sold off sharply in June 2022 (pre-Merge), bottoming near $900. Another capitulation occurred in November post-FTX collapse (post-Merge), as Bitcoin dragged the market to new lows. Yet Ethereum held firm: it did not set a new low. In fact, its bottom was ~27% higher than the June low. We believe this demonstrates the structural flow changes brought about by the Merge on September 16, 2022.
Commodity Valuation
ETH exhibits commodity-like characteristics because it is required to power the Ethereum blockchain—similar to how gasoline fuels a car or natural gas heats a home. What sets ETH apart is its unique supply mechanics: while new issuance has a cap (guided by the Ethereum Foundation), there is no limit to how much can be destroyed, or "burned."
The Ethereum Foundation's core challenge is to balance ETH consumption and issuance—ensuring more ETH is burned than created without making transaction fees prohibitively high. If gas prices spike, users may seek alternatives, just as drivers switch modes of transport when fuel costs soar. We expect transaction costs to decline over time, driven by Layer 2 scaling solutions, while transaction volume grows with broader adoption. Since L2 transactions ultimately settle on Ethereum's base layer, this should lead to lower fees alongside a deflationary token supply—a win-win scenario.
Predicting ETH's commodity value is complex—it hinges on supply and demand dynamics. Supply is relatively transparent, guided by the Ethereum Foundation's policies on staking rates and new issuance.
Demand, however, depends on what developers build. Users will flock to Ethereum when stablecoin payments become seamless; when games are engaging and let players truly own assets via NFTs; when major brands use NFTs to enhance loyalty programs; when social platforms give users control over their content; and when DeFi apps and wallets become intuitive, backed by robust KYC/AML frameworks and smart contract audit standards. We believe this evolution is inevitable, driven by the inherent advantages of open networks, user-centric models, and user-controlled data.
Store of Value / Monetary Asset
Within the Ethereum ecosystem, ETH acts as a medium of exchange—the fuel that keeps the blockchain running. Assets used primarily for exchange, like fiat currency, often struggle to retain value over time. Yet, given ETH's unique supply-and-demand structure outlined in this report, we believe the market may award it a monetary premium.
This potential premium stems from Ethereum's network effects, innovative use cases, and the growing demand for blockspace across competing Layer 1 ecosystems. It's worth noting, however, that from a user's perspective, ETH's price cannot rise indefinitely without making the network economically impractical to use.
Key Data Points
To assess Ethereum's long-term viability against other blockchains, several metrics are worth tracking. The following currently offer the strongest signals:
Number of Developers and Developer Growth
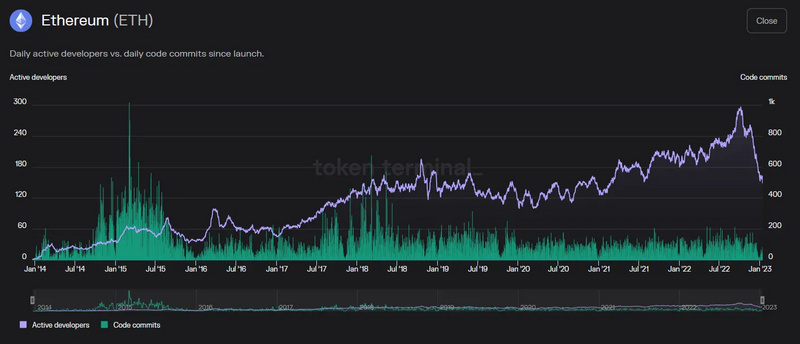
Data Source: Token Terminal
Over the past six years, the number of Ethereum developers has grown at a compound annual growth rate (CAGR) of 32%. Recent dips appear seasonal. Interestingly, code commits have plateaued for years and declined from earlier peaks. This reflects the power of composable, open-source code: solutions are built once, then reused and built upon—much like interlocking Lego bricks.
Number of Active Users and User Growth
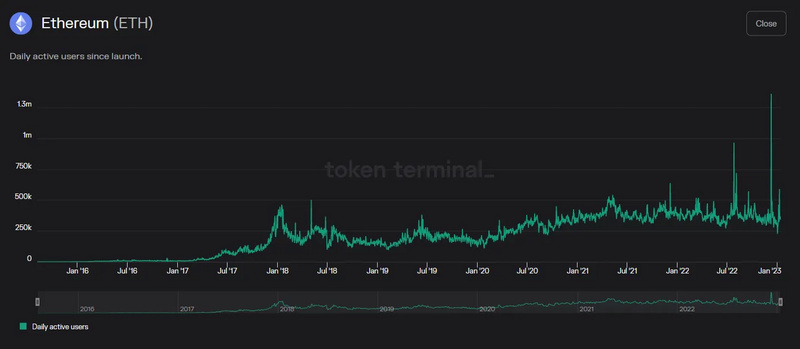
Data Source: Token Terminal
Daily active users currently hover around 400,000, showing stable growth. Since 2016, users have grown at a CAGR of 92.9%; since 2017, the CAGR is 38%. User numbers dipped by roughly 3% in 2022 compared to 2021.
Network Transactions and Transaction Growth
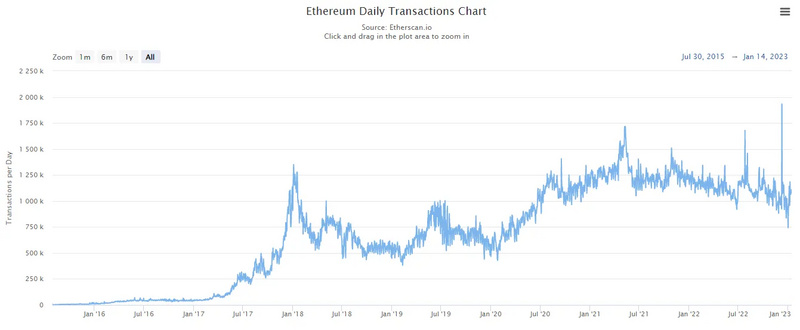
Data Source: Etherscan
Transaction volume remained resilient last year despite falling prices. This year, network transactions declined by 12%. Over the past six years, however, the CAGR is 76%, and over five years it's 32%. With the rise of Layer 2 scaling, growth on the base layer is beginning to plateau.
Revenue
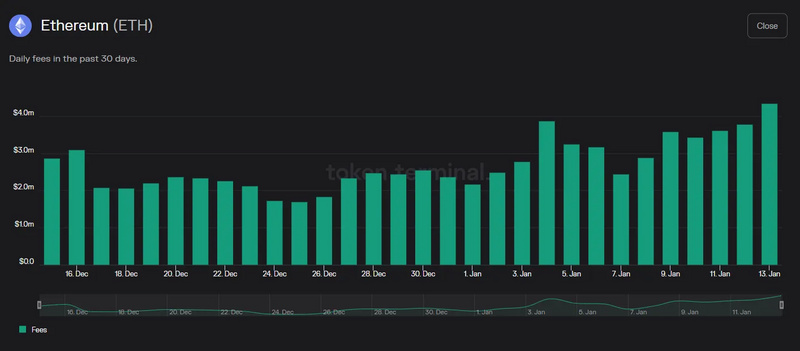
Data Source: Token Terminal
Ethereum's revenue remains strong. Over the past 30 days, the network generated roughly $2.6 million daily. The six-year CAGR is an impressive 454%. Starting from the more active year of 2017, the five-year CAGR is 146%, even though 2022 revenue fell 58% compared to 2021.
We also track Total Value Locked (TVL), though it's tightly coupled with crypto asset prices and can be volatile or manipulated—as seen last year on Solana. Within TVL, we focus on the amount of a blockchain's native asset locked up. For Ethereum, this represents about 26% of ETH (in DeFi and staking), with total TVL at $27 billion—orders of magnitude higher than any other blockchain.
Most importantly, blockchain adoption is still in its early stages. Our analysis must therefore focus on tracking developer activity—and the new projects, use cases, and network growth driven by Layer 2 scaling. As network effects strengthen, we can forecast and monitor relative strength and unit economics through key performance indicators. In short, Ethereum currently boasts the strongest network effects among Layer 1 smart contract platforms.