
Web3 is a dynamic ecosystem where founders, token holders, developers, and users come together to build a truly user-owned, decentralized internet. In just a few years, it has evolved from basic infrastructure and visionary ideas into a diverse range of innovative applications across finance, art, supply chain management, and more—including automated asset management, parametric insurance, and real estate tokenization.
This article first explores why the metrics for measuring Web3 are evolving and how developing more robust ones will benefit the entire ecosystem. We then detail various Web3-specific metrics used to gauge protocol adoption, compare growth across developer communities, analyze user behavior, and estimate the value Web3 can unlock. As the Web3 economy becomes increasingly intertwined with the real world, these new metrics have naturally emerged.
Key Takeaways
At current growth rates, Web3 is projected to reach one billion users by 2031.
The total value generated by Web3 systems is expected to reach $82.7 trillion.
New metrics like crypto user fees and realized transaction value (TVE) are gaining traction, offering a more nuanced view of the Web3 ecosystem.
How Are Web3 Metrics Evolving?
While current Web3 metrics are useful for tracking growth, the ecosystem can become overly reliant on them. Because markets often reward projects based on figures like total value locked (TVL), teams may prioritize chasing these numbers over achieving genuine product-market fit and real-world adoption. This highlights the need for more robust metrics—such as dApp revenue, daily active users (DAU), and realized transaction value (TVE)—to better evaluate a protocol's fundamentals.
A range of innovative metrics has emerged to capture the dynamics of the Web3 space. To fully understand its evolution, we need a diverse toolkit that measures investment, developer activity, user engagement, and overall ecosystem health.
Key Trends Driving the Evolution of Web3 Metrics:
Capital — As the Web3 ecosystem matures and interest rates climb, capital is shifting its focus toward metrics that signal economic sustainability, such as revenue, cost efficiency, and overall value capture.
Developers — New developer tools are making it easier for Web2 developers to transition into the Web3 ecosystem.
Users — Scaling solutions are reaching a tipping point, poised to drastically reduce transaction fees and make Web3 services competitive with their Web2 counterparts.
Ecosystem — Core infrastructure projects like Chainlink are bridging the gap between the Web3 ecosystem and real-world assets.
While the following metrics don't capture the full picture of the Web3 ecosystem, they highlight key growth trajectories and provide a solid framework for evaluating emerging Web3 economies.
Metrics for Assessing Protocol Economic Strength
Total Value Locked (TVL)
Total Value Locked (TVL) measures the total dollar value of digital assets deposited in a protocol. While metrics like user count gauge adoption and growth, TVL reflects the total assets under management—including significant contributions from "whales."
The rise of yield farming during the 2020 DeFi Summer cemented TVL as the go-to metric for comparing Web3 projects. For instance, Aave's TVL skyrocketed from $899 million on October 21, 2020, to $18.97 billion just one year later.
Aave's TVL grew more than twentyfold during the DeFi Summer.
As Web3 evolves, a growing volume of real-world assets (RWAs) is being tokenized and stored on-chain. This makes TVL a useful indicator of how deeply Web3 is integrating with traditional economies. "Real-world value" here refers to the total value of all on-chain assets from the global economy, including real estate, USD-backed stablecoins, carbon credits, and commodities.
The World Economic Forum projects that Web3 systems could unlock $82.7 trillion in value across the global economy. As Web3's connection to the physical world deepens—and as it enhances traditional systems with secure, trust-minimized infrastructure—more real-world assets will move on-chain. This migration will enable safer storage and broader utility within DeFi and other dApps.
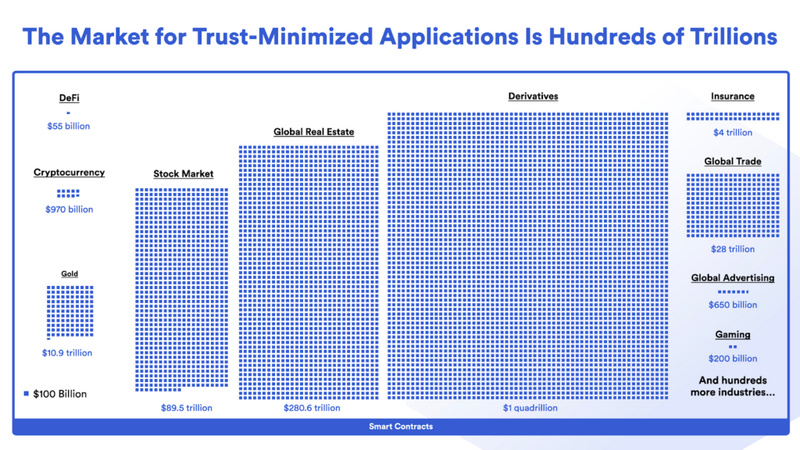
Web3 is poised to unlock trillions of dollars in on-chain value.
TVL on Ethereum L2s
Ethereum is evolving from a monolithic blockchain into a modular ecosystem. While transactions were once processed directly on the base layer, a growing number of dApps now operate on Layer 2 (L2) networks like Arbitrum, Optimism, zkSync, and Starknet. Tracking the growth of Total Value Locked (TVL) across these L2s offers a clear window into Ethereum's scaling progress and how liquidity is being distributed.
Total Value Locked (TVL) Across Ethereum L2 Networks
dApp Revenue
dApp revenue refers to the fees a protocol earns from its users. It's a key metric for evaluating L1 blockchains, infrastructure services, and dApps themselves.
While not yet a top priority for early-stage Web3 startups or projects in their growth phase, many mature projects are starting to focus on it. As Synthetix founder Kain Warwick put it: "In my view, crypto user fees are the next critical metric."
dApp revenue is becoming a vital metric for the Web3 ecosystem for two main reasons:
First, it directly measures end-user demand for Web3 services and helps identify sustainable, long-term business use cases.
Second, with L2 scaling solutions driving transaction fees to extremely low levels to compete with Web2, dApp revenue has become a crucial metric for comparative analysis.
Revenue is another traditional metric investors use for valuation. High-revenue ecosystems naturally attract more capital.
In Web3, dApp revenue can generate income for the underlying blockchains and infrastructure services, making it a key success factor for any ecosystem.
Developer Metrics for Assessing Web3 Productivity
GitHub Stars
On GitHub, users can "star" a repository to bookmark it or simply show their support. Beyond star counts, the number of forks and contributors also serves as a strong indicator of a project's influence.
Bitcoin, as the original blockchain, leads with the highest number of GitHub stars—three times more than other projects—underscoring its enduring reputation. Recently, other blockchains have also gained significant traction. For instance, Solana's repository boasts 9,300 stars, reflecting its rapid growth over the past year. That figure is currently half of the Solidity repository's 18,100 stars.
The rising number of GitHub stars for the Web3.js codebase is another key indicator, as it reflects the growing community of frontend developers building in the Web3 ecosystem.
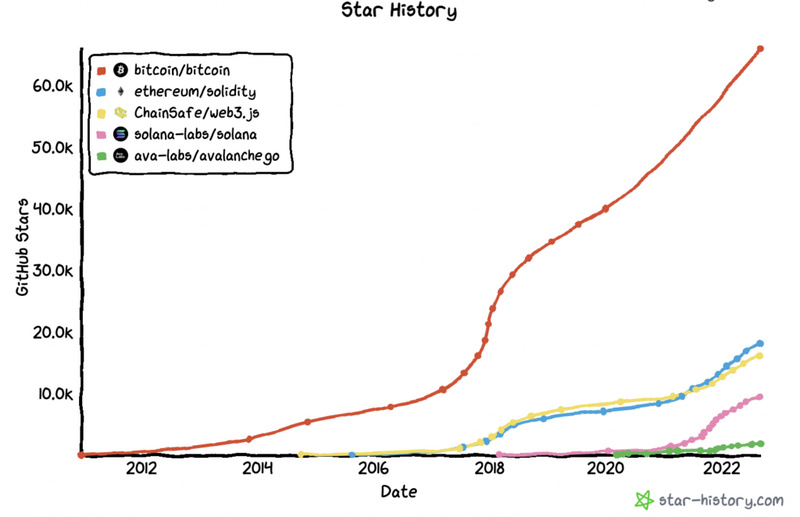
GitHub star counts for Bitcoin, Solidity, Web3.js, Solana, and AvalancheGo.
Monthly Active Developers
This metric tracks the number of programmers actively contributing to a specific blockchain network.
As the first smart contract platform, Ethereum sparked a wave of early innovation across the industry. It fostered a vibrant developer community and built a comprehensive suite of tools and resources to drive its ecosystem forward. As the chart below illustrates, Solana's growth pattern closely resembles Ethereum's in its early days.
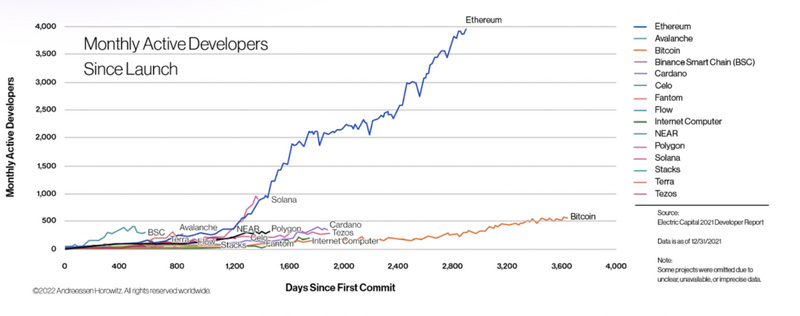
Monthly active developer growth from December 2020 to December 2021.
Key User Metrics
Unique On-chain Addresses
This metric tracks the total number of distinct addresses on a blockchain. It's a crucial indicator of network effects, reflecting the rapid growth of Web3 and the number of individuals engaging with blockchain technology.
By measuring unique addresses across all blockchains, we can gauge overall Web3 adoption. Comparing active addresses on different chains also allows us to analyze and contrast the health of various blockchain ecosystems.
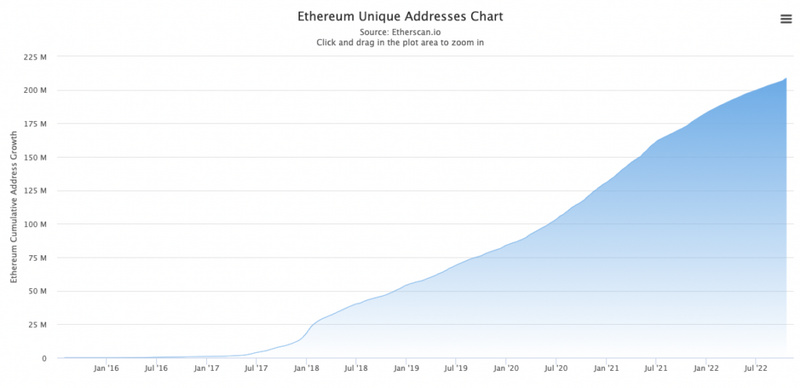
Growth of unique addresses on Ethereum.
We can also benchmark the number of unique on-chain addresses against historical internet user data. Since Web3 is the next evolution of the internet, comparing current active on-chain addresses to early internet adoption figures provides a useful perspective.
In its "2022 State of Crypto" report, a16z estimates Ethereum currently has between 7 million and 50 million active users. This puts Web3's adoption roughly on par with the internet in 1995. At this trajectory, Web3 is projected to reach one billion users by 2031—matching the internet's user base in 2005.
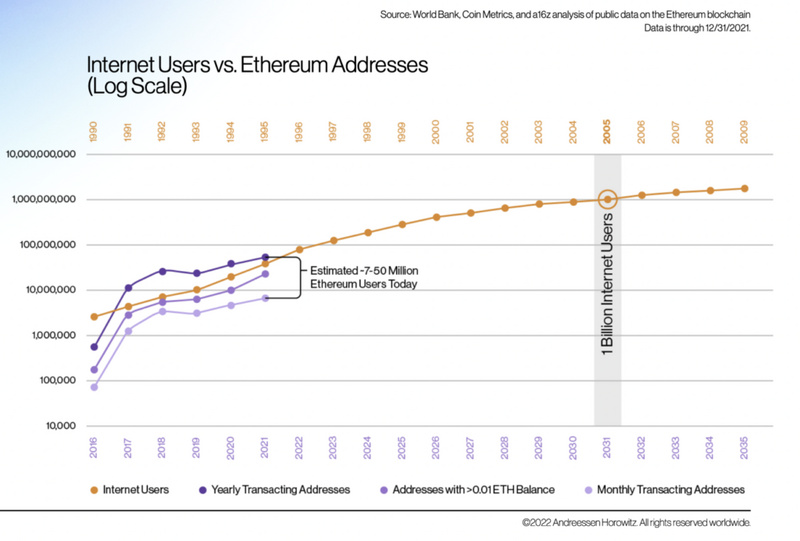
Web3's adoption curve closely mirrors that of the early internet.
Daily Active Users (DAU)
Daily Active Users (DAU) measures the number of unique users who engage with an application on a given day. While on-chain active addresses indicate overall network growth, DAU is a more direct gauge of a specific application's traction and success.
This metric helps identify which services are gaining momentum, allowing developers to focus their efforts on promoting and scaling the most promising use cases.
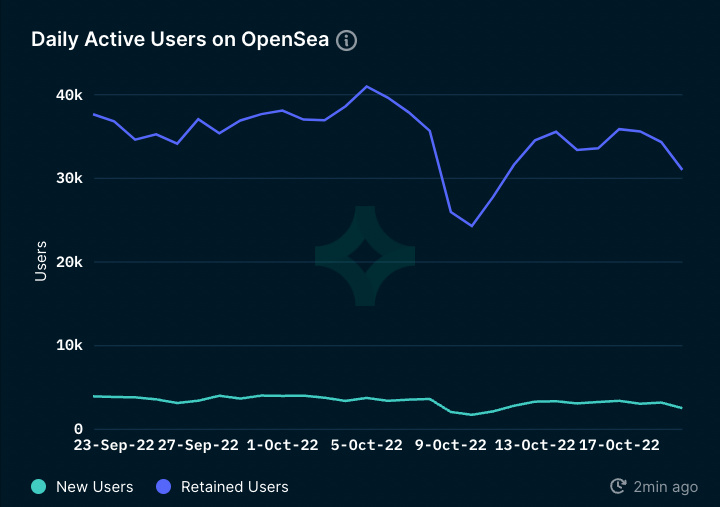
Daily Active Users (DAU) for the NFT marketplace OpenSea.
Key Metrics for Gauging Web3's Real-World Impact
Crypto Market Cap
Crypto market cap represents the total value of all tokens in the Web3 ecosystem. It's a key indicator of the industry's overall financial health and a useful gauge for identifying bull and bear markets. To illustrate the sector's growth: the total market cap skyrocketed from $1.7 billion in early 2017 to $2.9 trillion by November 2021.
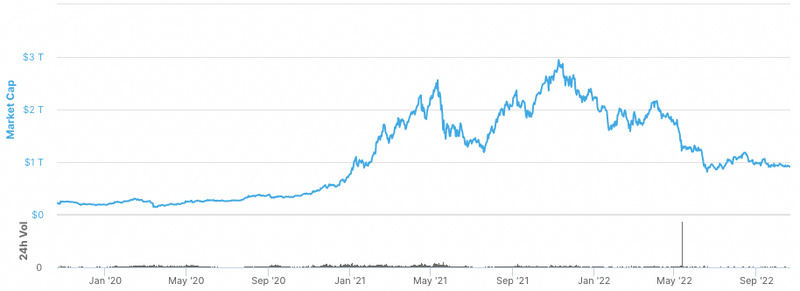
Crypto market cap since September 2019.
Bitcoin Dominance
The chart below shows Bitcoin's share of the total crypto market cap. While Bitcoin continues to grow steadily, the rest of the crypto ecosystem is expanding even faster, demonstrating remarkable vitality. As this trend persists, the need for a secure, decentralized, and reliable cross-chain interoperability protocol will only become more critical.
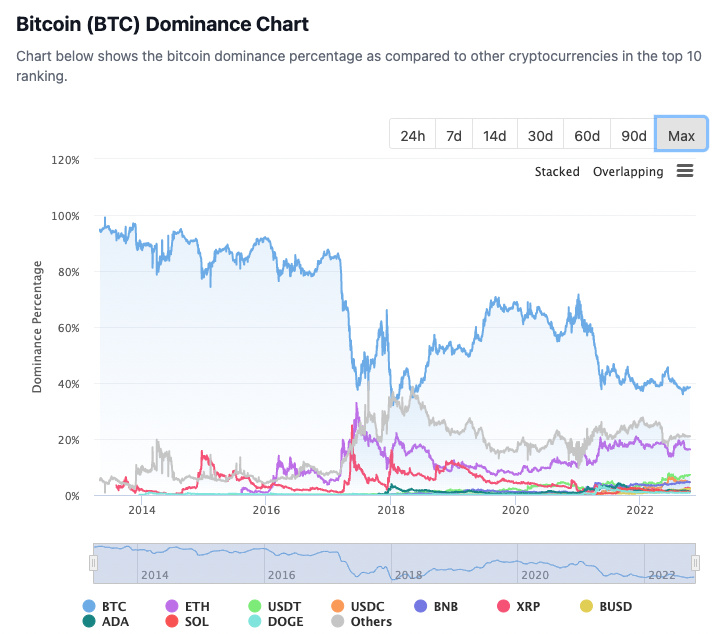
While Bitcoin still commands the largest market share, its dominance is waning.
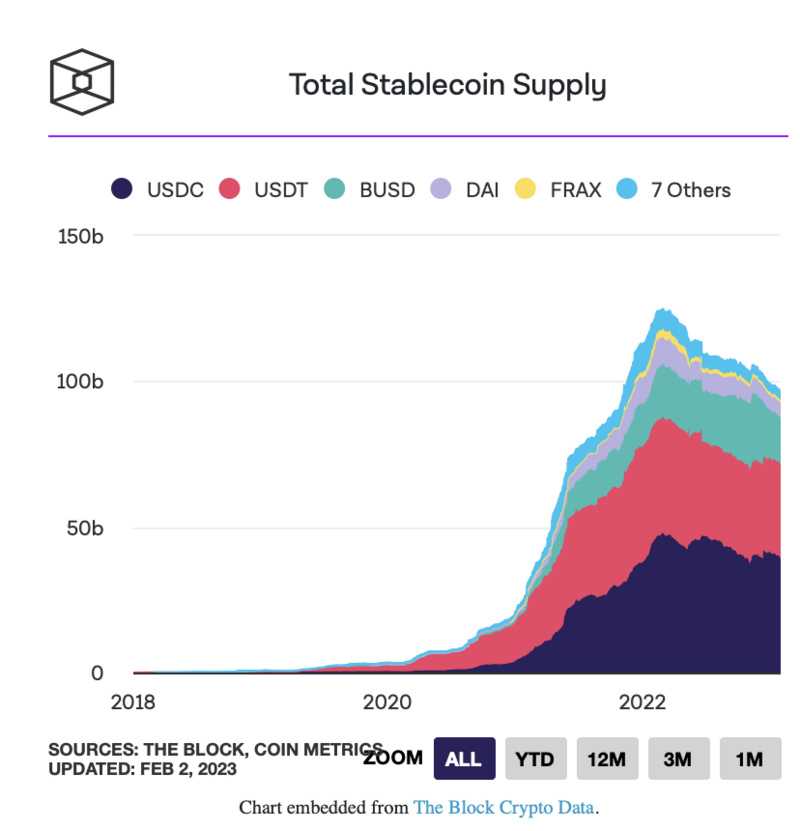
Total Stablecoin Supply
Stablecoins are a fundamental on-chain financial primitive that underpins the growth of the entire DeFi ecosystem. These fiat-pegged tokens allow users to hold assets with stable prices, serve as a medium of exchange across Web3, and function as collateral for yield farming and other DeFi applications.
Trading Volume
Transaction volume measures the number of transactions processed within a specific timeframe. For instance, daily transactions across the Ethereum ecosystem surged from 500,000 in early 2020 to 1 million by August 2022.
While market capitalization reflects an ecosystem's financial health, transaction volume indicates its capacity for scaling. As the space evolves, transaction volume on Layer 2 networks is becoming a crucial performance indicator.
Overall, Ethereum's transaction volume has roughly doubled over the past two years.
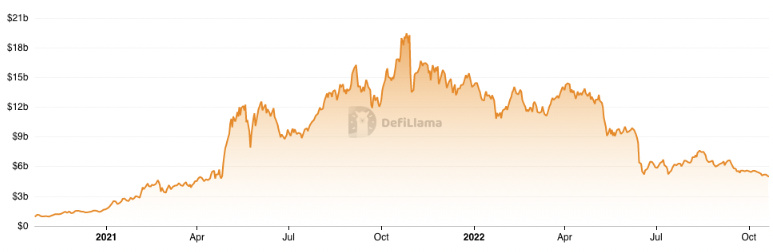
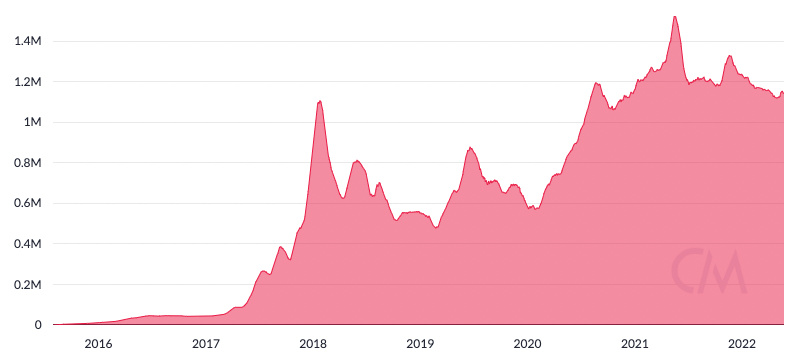
Total Value Secured (TVS)
TVS represents the total USD value of assets deposited into markets secured by critical infrastructure like oracles. Chainlink oracles, for example, supply on-chain smart contracts with data feeds—including price data, weather information, sports stats, and proof-of-reserves. As of October 17, 2022, Chainlink Price Feeds secured over $1 billion in stablecoins for Compound, a figure included in Chainlink's TVS.
TVS is a crucial metric. Oracle networks bridge deterministic blockchains with external systems and real-world economies, all while upholding high standards of trust minimization and security.
For instance, Chainlink's TVS surged by 300%, climbing from $7 billion in December 2020 to $20 billion by October 2022.
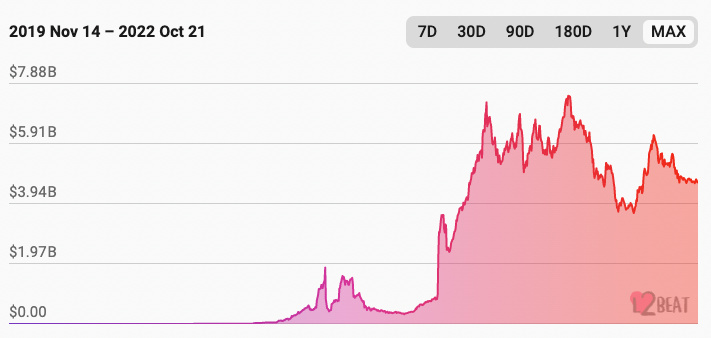
Transaction Value Executed (TVE)
TVE is a Web3 metric that tracks the total monetary value of transactions a protocol processes over a specific period. It's calculated by adding up the dollar value of every transaction the protocol handles. For example, if a user borrows $100 worth of ETH on Aave using Chainlink Price Feeds for pricing, that transaction contributes $100 to the TVE.
While TVS captures the value secured by essential Web3 infrastructure at a snapshot in time, TVE measures the cumulative value of activity over a period. As such, TVE offers a more advanced and dynamic view into the Web3 ecosystem.
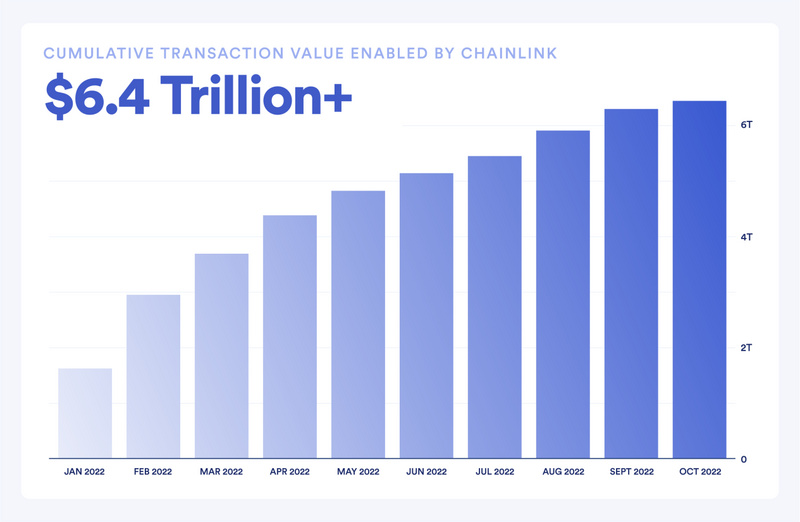
In 2022, the Total Value Escrowed (TVE) secured by Chainlink's oracle network exceeded $6 trillion.
The Rise of the Web3 Economy
The evolution of Web3 is driven by projects that use incentive mechanisms to attract developers, spur innovation, and build next-generation applications. This attracts more users and captures greater value, creating a virtuous cycle that fuels the entire ecosystem. In many ways, Web3's growth mirrors that of a developing economy: capital flows in to build core infrastructure and boost productivity. Now, the industry is on the cusp of expanding into new markets.
Chainlink's decentralized oracle network is central to this expansion. By securely connecting smart contracts to real-world data and systems, it enables the Web3 ecosystem to interact with established industries in advanced global markets. As Chainlink's trust-minimized services proliferate across the Web3 economy, its Total Value Escrowed (TVE) will emerge as a crucial metric, providing a clearer view of Web3's growing impact on the global economy.