
"Dedao Think Tank | 2022–2023 Global Cryptocurrency Market Annual Report: A New Beginning" offers a comprehensive analysis and review of the 2022 global crypto market, authored by ChainDD's research team, Dedao Think Tank.

This report first provides a broad overview of shifts in the global cryptocurrency market cap and the performance of the top 30 cryptocurrencies. It then summarizes the key trending sectors within Web3 for the year. The report also reviews the centralized exchange (CEX) landscape—highlighted by events at platforms like FTX and Binance—and the challenges they encountered. Finally, it outlines regulatory developments and policy initiatives concerning cryptocurrencies across major global jurisdictions. The goal is to deliver efficient, professional, and clear insights to support decision-making for investors, entrepreneurs, developers, and other market participants.
The report is structured into four chapters:
Chapter I: The 2022 Global Cryptocurrency Market: A Contraction Exceeding 50%, with a Year-on-Year Decline of ~64.51%
Chapter II: Web3 in the Midst of Internet Industry Transformation
Chapter III: Turbulence in the CEX Market: From Bankruptcies to Black Swan Events
Chapter IV: A Policy Review of Cryptocurrency Regulations Across Major Global Jurisdictions
In Chapter I, the Dedao Think Tank team provides a comprehensive review of the global cryptocurrency market's performance in 2022. It analyzes ranking changes among the top 30 cryptocurrencies and offers in-depth assessments of several key and representative tokens. The full content of Chapter I is presented below:
Chapter I: The 2022 Global Cryptocurrency Market: A Contraction Exceeding 50%, with a Year-on-Year Decline of ~64.51%
According to CoinMarketCap data compiled by Dedao Think Tank, as of January 1, 2023, there were 22,163 cryptocurrencies globally with a combined market capitalization of approximately $79.87 billion. This represents a decline of roughly $145.16 billion from the total market cap of about $225.03 billion on January 1, 2022, marking a year-on-year drop of approximately 64.51%.
—1—
2022 Cryptocurrency Market Overview
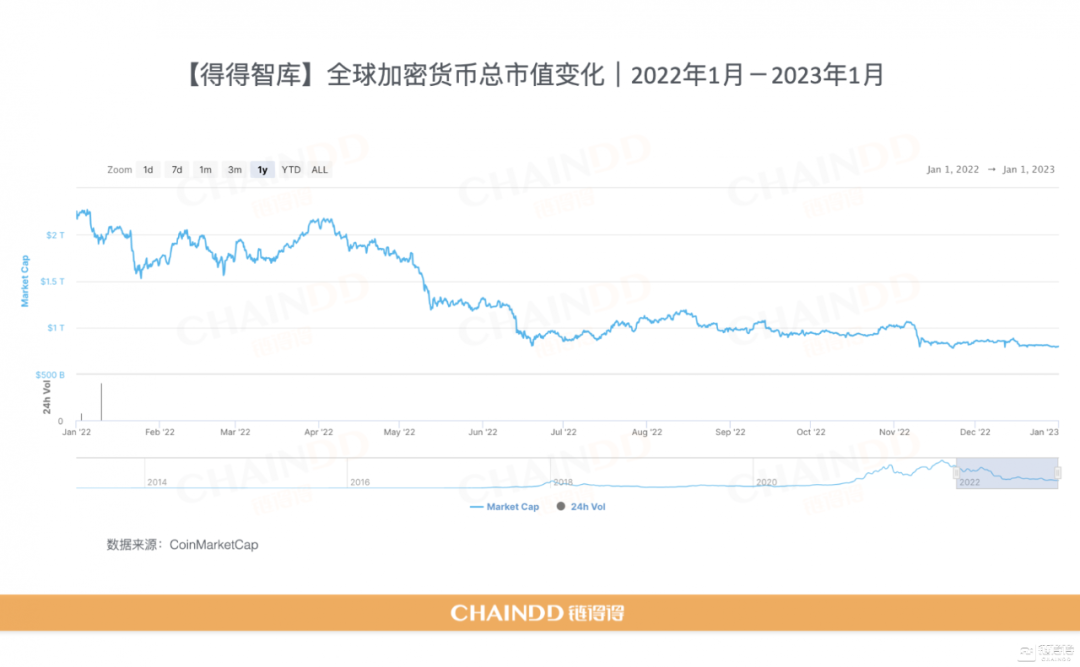
The total market capitalization peaked at around $2.26 trillion on January 3, 2022, and hit a yearly low of approximately $781.55 billion on November 22, 2022—a difference of about $1.48 trillion.
Looking at the overall trend, the year began with two major downturns: one triggered by the Russia-Ukraine conflict starting February 24, and another following the U.S. Federal Reserve's announcement of its first interest rate hike in two years on March 17. Despite these shocks, the market repeatedly recovered to a market cap level near $2 trillion.
Starting in April, the cryptocurrency market entered a sustained decline, driven by multiple U.S. interest rate hikes and the collapse of Terra's algorithmic stablecoin in May. The market only began to stabilize in July, by which point the total crypto market cap had fallen to around $1 trillion—roughly half its value at the start of the year.
In November, the collapse of the centralized exchange FTX and its subsequent ripple effects reignited the market's downward trend. In December, heightened regulatory scrutiny of another major CEX, Binance, further fueled panic. By the end of 2022, the total cryptocurrency market capitalization had fallen below $800 billion and continued to drift slightly lower.
—2—
Annual Price & Volume Trends of Major Cryptocurrencies
BTC
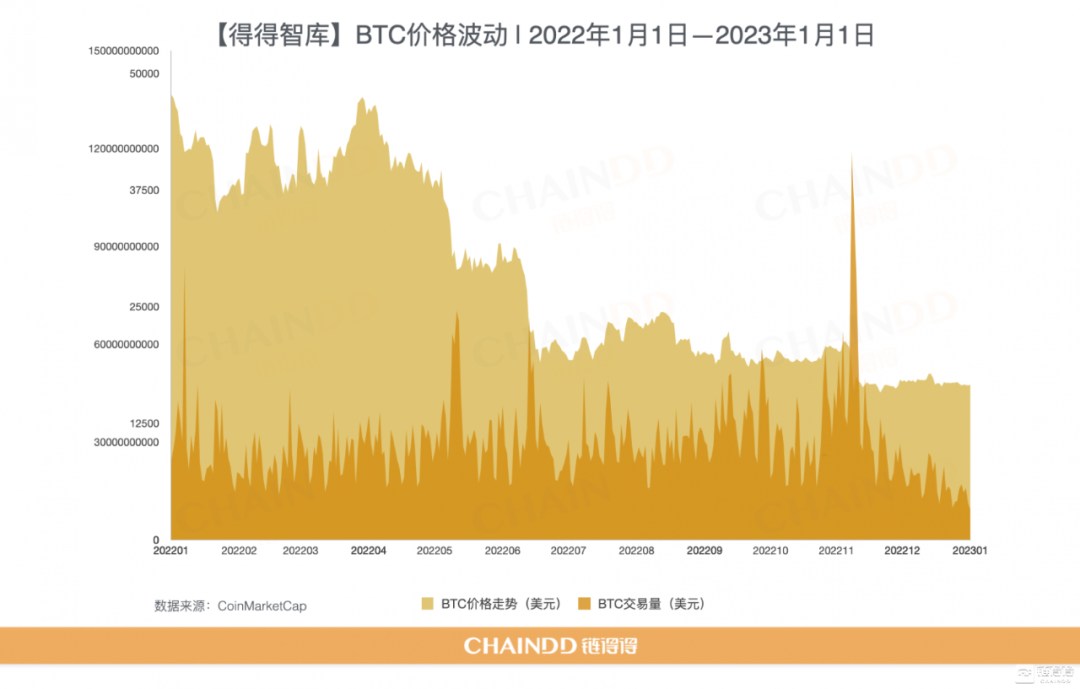
Bitcoin surged past $68,000 in November 2021 to reach an all-time high. However, in 2022, it failed to break $70,000 and dropped below $50,000 early in the year—a decline of nearly 30%. Bitcoin's highest price in 2022 was $47,686.81 (on January 2), while its lowest was $15,782.16 (on November 22).
From January to April 2022, Bitcoin's price oscillated, unable to break above $48,000 despite several attempts. Notably, the outbreak of the Russia-Ukraine conflict on February 24 caused Bitcoin's price to fall below $35,000 that same day—its lowest level since July 2021.
In May, the Terra incident triggered widespread panic, sending Bitcoin into a steep decline back to around $38,000. June saw another sharp drop, with the price plunging from around $30,000 to roughly $19,000 over the month, intensifying the panic that carried into July.
In November, Bitcoin experienced a more modest dip amid the FTX bankruptcy and related events. As the chart shows, trading volumes spiked sharply during each of these price declines.
By the end of 2022, the fallout from FTX's collapse continued to spread, impacting major crypto institutions like Grayscale's subsidiary, Genesis. Meanwhile, Binance remained under intense scrutiny from U.S. regulators, and other crypto institutions and exchanges were largely inactive. Consequently, Bitcoin may not see significant new momentum until the next "halving" event.
ETH
For Ethereum, the year's most significant event was the successful completion of "The Merge." At 14:42 Beijing time on September 15, Ethereum's execution layer (the former mainnet) merged with its proof-of-stake (PoS) consensus layer (the Beacon Chain) at block height 15,537,393, producing its first PoS block (height 15,537,394). This officially transitioned Ethereum's consensus mechanism from proof-of-work (PoW) to PoS.
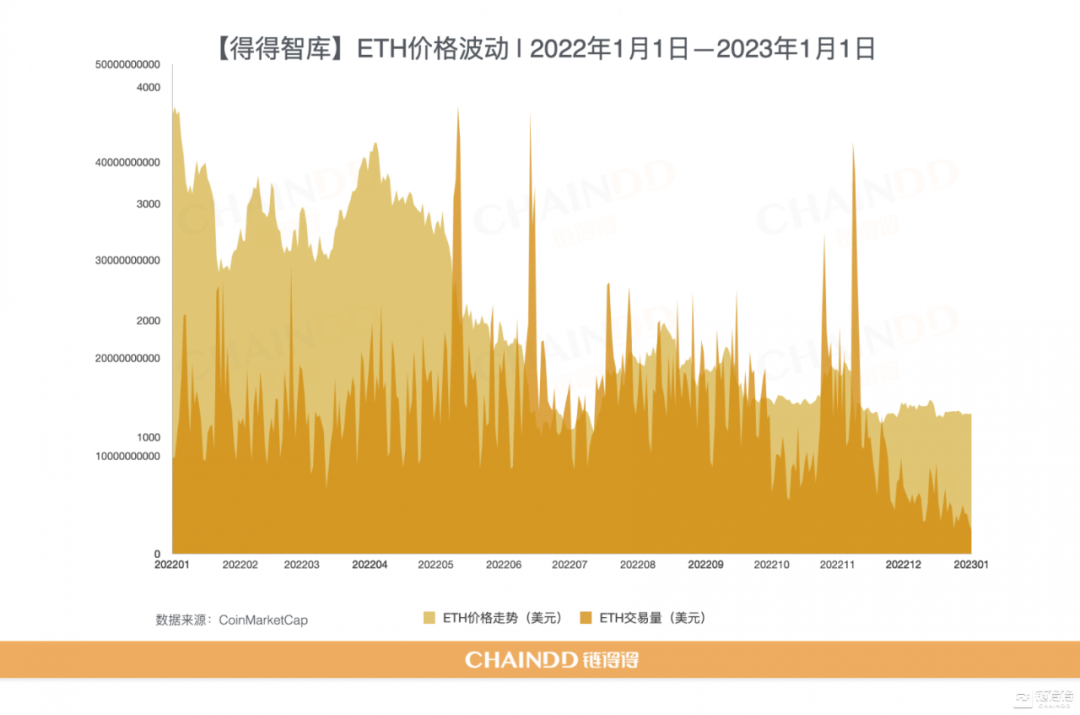
However, this milestone did not provide a significant boost to Ethereum's price. As the chart shows, Ethereum's price trajectory closely mirrored Bitcoin's. It reached its 2022 high of $3,829.57 at the start of the year and hit an annual low of $1,038.19 in mid-July—a decline of $2,791.38, or roughly 73%. Similarly, trading volume surged with each price drop. At the time of publication, Ethereum's price was fluctuating around the $1,200 mark.
It is important to acknowledge that Ethereum's Merge has officially launched a new crypto赛道. As the flagship PoS token, Ethereum is set to reach several critical milestones in 2023, including the Shanghai Upgrade, which remains highly anticipated. Scheduled for March 2023, the Shanghai Upgrade will enable withdrawals of staked ETH from the Beacon Chain.
Meanwhile, the fierce "public chain war" among Ethereum Layer 2 solutions shows no signs of slowing down. zkSync 2.0 officially launched its mainnet at the end of the year and is rapidly expanding its ecosystem, with key milestones already scheduled for Q1 and Q2 of 2023. Optimism, another major Layer 2 player, continues to grow despite a June operational error that led to the theft of 20 million OP tokens. According to The Block, both Optimism and Arbitrum have seen transaction volumes climb steadily, peaking in September. In terms of market share, Arbitrum currently leads all Layer 2 protocols with a 50% share of the Total Value Locked (TVL), while L2Beat data shows Optimism holds roughly 30%. A significant reshuffling of Layer 2 market shares is anticipated in early 2023.
BNB
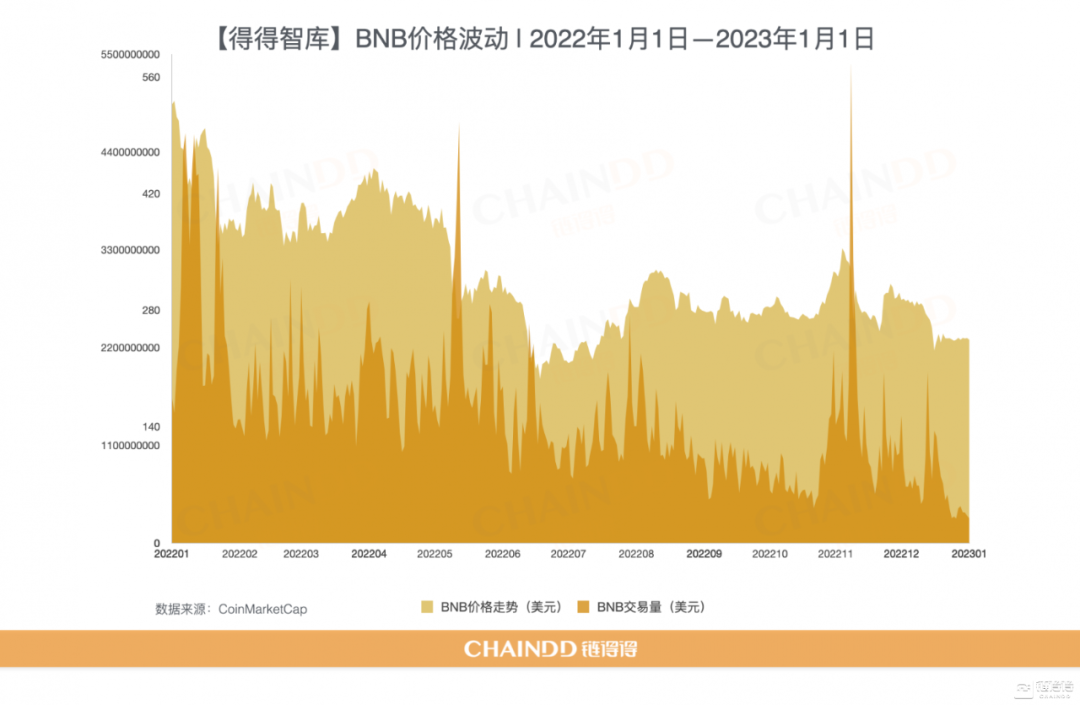
BNB's price action this year largely followed Bitcoin's, hitting a yearly high of $531.40 early on before falling to a low of $197.04 by year's end.
While Binance remains the dominant centralized exchange (CEX), it faces intense regulatory pressure. The ecosystem also suffered a major blow in October when BNB Chain was hacked for over $850 million—the largest Web3 exploit to date. In mid-December, Binance's audit firm, Mazars, severed ties with the exchange, triggering billions in withdrawals. Fears that Binance could become "the next FTX" drove BNB's price even lower, dimming prospects for a significant rebound in early 2023.
Despite these challenges, Binance aggressively expanded its global footprint this year. On November 30, it fully acquired Japanese crypto brokerage Sakura Exchange Bitcoin (SEBC). Following its earlier acquisition of Indonesian exchange Tokocrypto, Binance increased its stake to nearly 100%. It also purchased assets from bankrupt crypto lender Voyager Digital for $1.022 billion. However, the year's most defining event for Binance was its entanglement with the FTX saga, explored in detail in Chapter Three of this report: "The Turbulent CEX Market: From Bankruptcy to Black Swan Shadows."
DOT
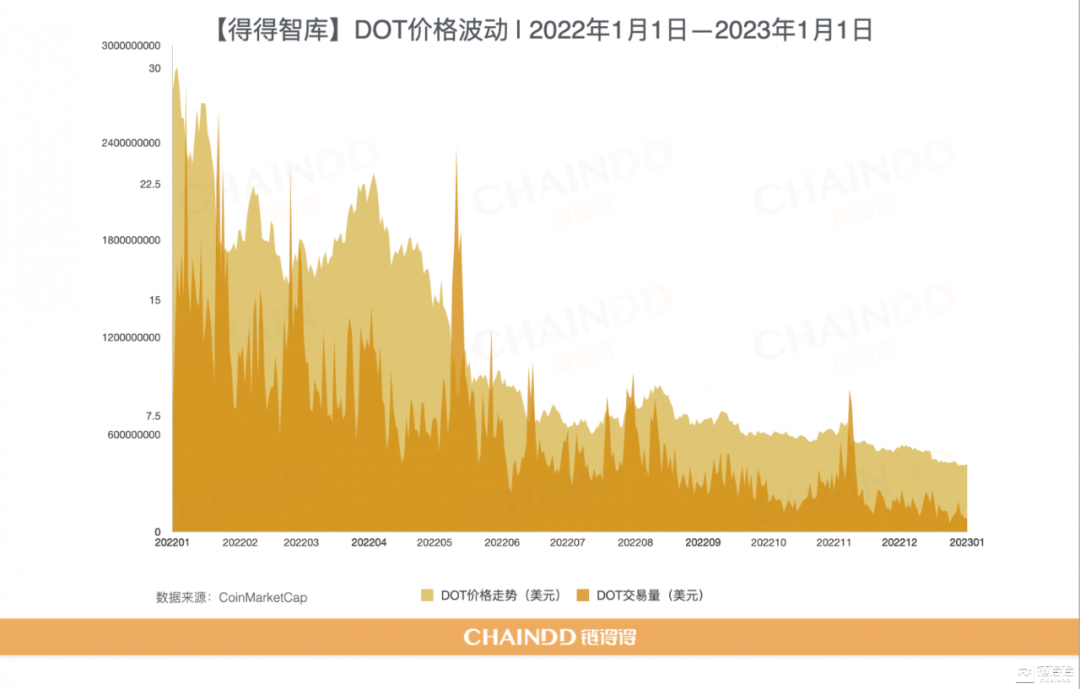
As a pioneer of application-specific blockchains, Polkadot saw rapid growth during the 2020 bull market, attracting developers with its robust toolkit and rich ecosystem. However, that momentum proved short-lived, as reflected in the price of its native token, DOT, throughout 2022. Starting the year at a high of $30.11, DOT steadily declined to around $4.50 by December—a drop of over 85%.
Progress within the Polkadot ecosystem has generally fallen short of expectations, and the network lacks compelling, exclusive features for applications. Furthermore, its limit of 100 parachains may deter new developers. A significant leadership change occurred on October 21 when Gavin Wood, Polkadot's co-founder, stepped down as CEO of its core development firm, Parity Technologies. Without its visionary leader, Polkadot's path forward appears increasingly challenging.
ADA
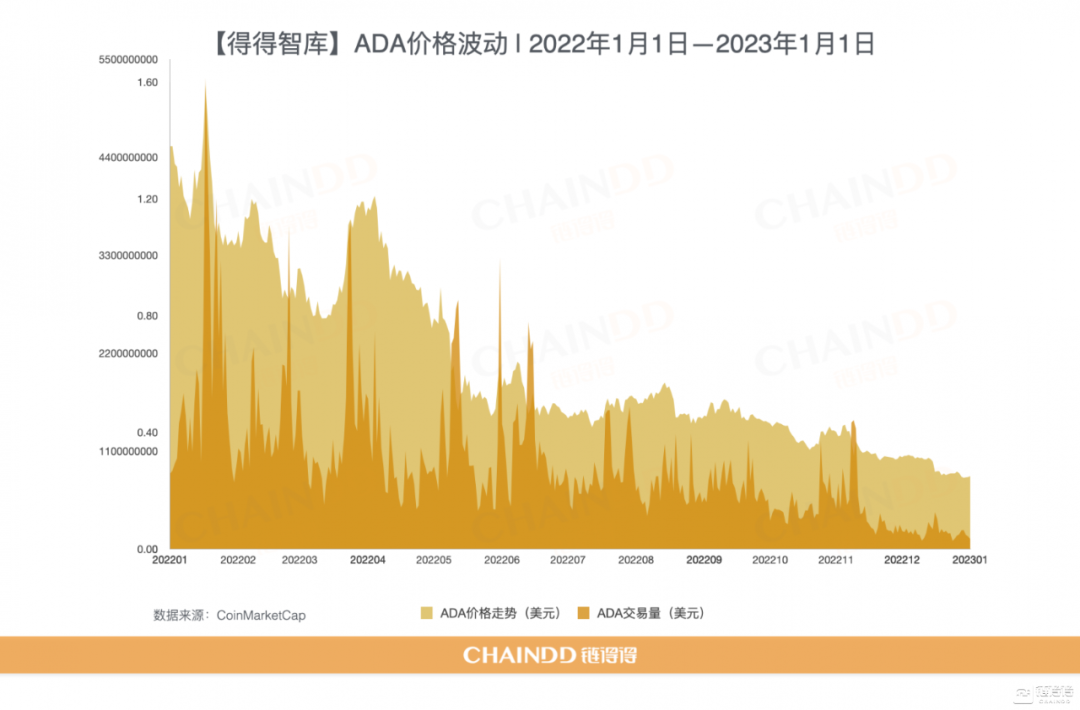
In 2022, ADA traded between a high of $1.59 and a low of $0.3045, following the broader crypto market's overall downward trend.
As one of the two leading cross-chain ecosystems, Cosmos launched slightly before Polkadot, though its progress initially lagged. Today, however, market expectations for Cosmos are higher. Technologically, Cosmos holds significant advantages: the Cosmos SDK allows for rapid blockchain development; the Inter-Blockchain Communication (IBC) protocol enables permissionless cross-chain interoperability; and the Tendermint consensus is the first internet-grade Byzantine Fault Tolerant (BFT) mechanism.
Furthermore, Cosmos can leverage the substantial assets within its ecosystem, especially following Terra's collapse. The Cosmos 2.0 proposal, inspired by Polkadot, would allow app-specific chains to partially share security with the Cosmos Hub while paying fees in their native tokens. This would increase rewards for ATOM stakers on the Hub, indirectly boosting ATOM's value. Long-term, Cosmos's growth prospects remain promising.
SOL
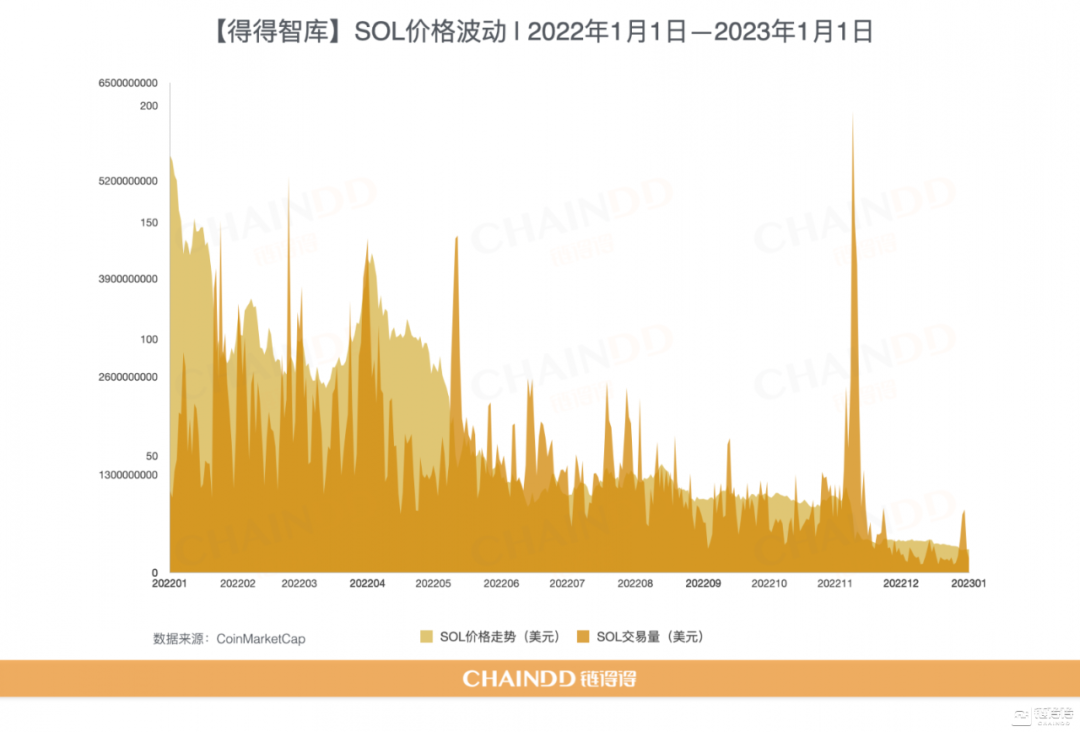
Solana, a public chain backed by FTX, enjoyed strong market optimism. Development progressed well in early 2022, with SOL reaching a yearly high of $178.52. However, FTX's collapse in November triggered a sharp crash, prompting a mass exodus of users and surging trading volumes. As of publication, SOL trades near $11—down more than 16x from its peak.
LUNA/UST

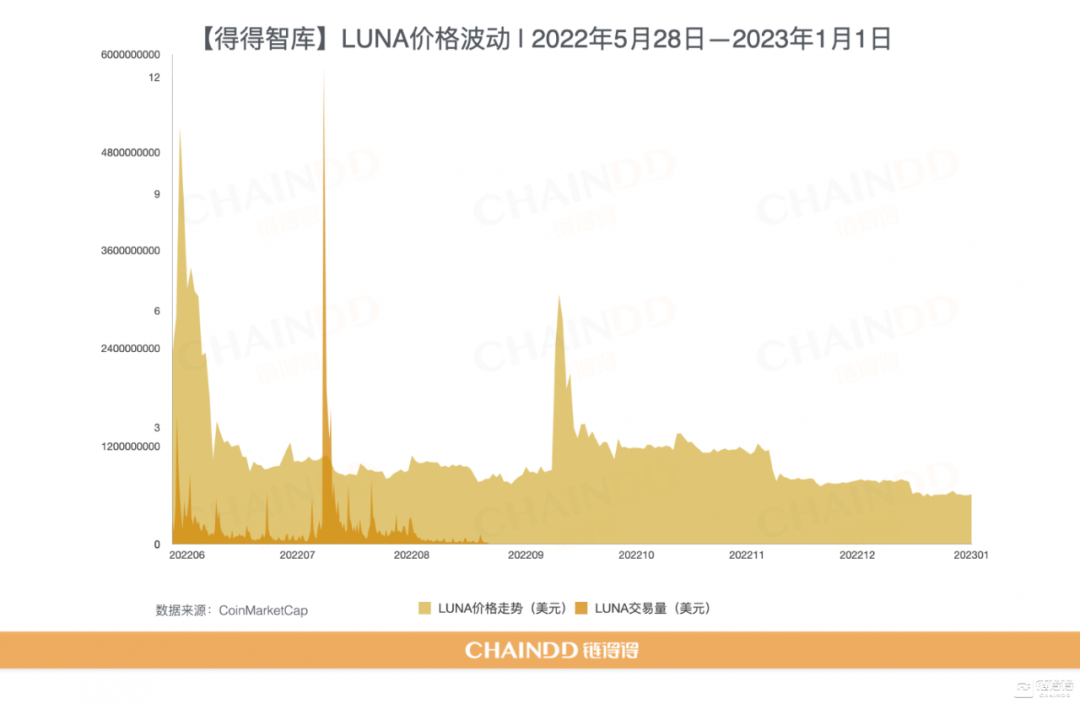
Terra surged in April, fueled by Anchor—a deposit app offering a 20% APY on its algorithmic stablecoin, UST. This propelled the combined market cap of UST and LUNA toward $40 billion, briefly making LUNA a top-five cryptocurrency. To defend UST's peg, the Luna Foundation Guard (LFG) bought 42,000 BTC as collateral that month, becoming the world's seventh-largest Bitcoin holder. Terra seemed poised to become the most successful algorithmic stablecoin project, but this proved to be its last gasp before collapse.
On May 8, UST suffered a severe de-pegging triggered by capital attacks and a debt crisis. Panic spread rapidly, amplified by FUD on Twitter, leading to massive sell-offs of both UST and LUNA. Terra's dual-token model entered a "death spiral." Despite repeated rescue attempts by founder Do Kwon and the LFG, the situation spiraled into a full-blown catastrophe.
In less than a week, UST crashed from $1 to roughly $0.10, while LUNA plummeted from around $70 to $0.000000999967. Although Terra relaunched LUNA in late May, the project remained in crisis. Post-relaunch, LUNA's price saw only one notable rally in September before resuming its decline, trading between a high of $8.88 and a low of $1.49.
The Terra collapse devastated its own ecosystem and sent shockwaves throughout the industry. Markets plunged, panic intensified, liquidity dried up, and multiple firms—including hedge fund Three Arrows Capital, lender Celsius, Voyager Digital, BlockFi, and Babel Finance—filed for bankruptcy or restructuring. Exchanges like AEX and Huobi suspended services. South Korean courts continue to investigate the incident, while Terra founder Do Kwon remains at large.
FTT
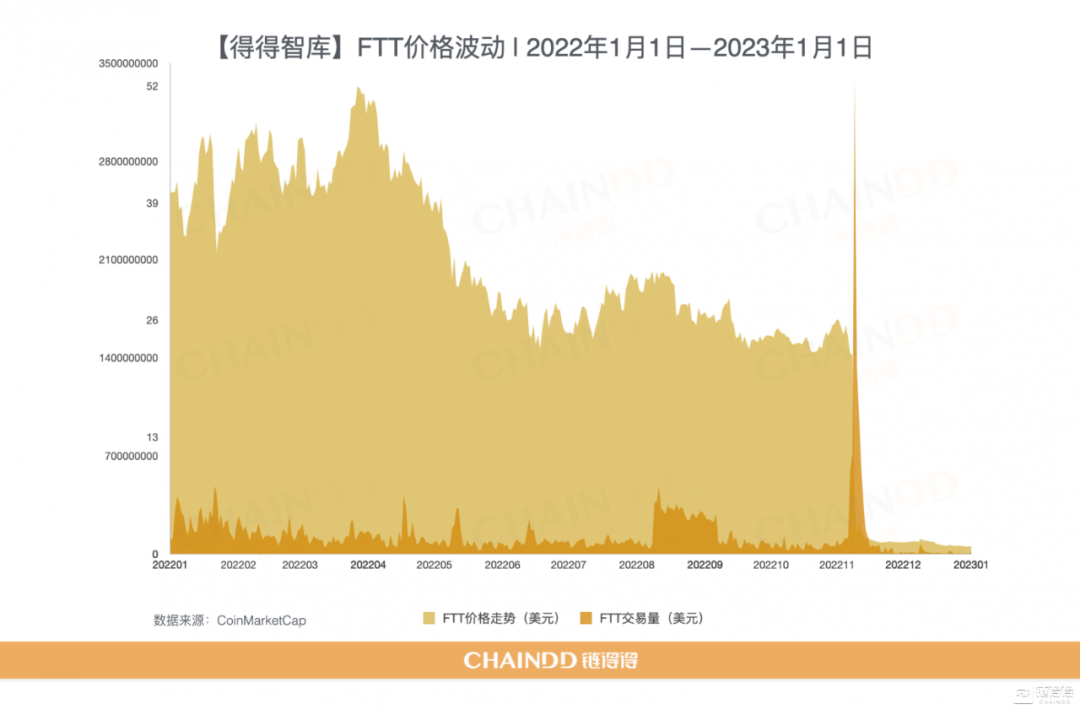
FTX carved out a major presence in the centralized exchange arena, largely thanks to its derivatives trading, which allowed it to rapidly gain ground on Binance. Its native token, FTT, enjoyed strong market sentiment early in the year, driving its price to an all-time high near $52 in April. FTT's market cap also climbed steadily, breaking into the Top 30 cryptocurrencies in February and peaking at the #21 spot.
However, by November, FTX—along with its sister trading firm Alameda Research—was engulfed in a crisis fueled by opaque liabilities. Mounting debts, a bank run, and massive FTT sell-offs then triggered a swift collapse into bankruptcy. On November 7 alone, FTT plummeted from $22 to around $3, while daily trading volume surged past $3.3 billion. By year's end on December 31, the token had fallen to $0.84.
The fallout continues to unfold, with ongoing developments in FTX's bankruptcy proceedings and the arrest and imprisonment of its former CEO, Sam Bankman-Fried (SBF).
DOGE

Backed heavily by Tesla and Twitter CEO Elon Musk, DOGE consistently held a spot among the top six cryptocurrencies by market cap throughout 2022. While its price never broke the $0.20 barrier, both its market cap and trading volume saw steady growth. A notable spike occurred in late October following Musk's acquisition of Twitter, with DOGE's price soaring to a peak of $0.1656—nearly matching its level at the start of the year. However, broader market pressures eventually pulled the price back down to around $0.07 by December.
SHIB
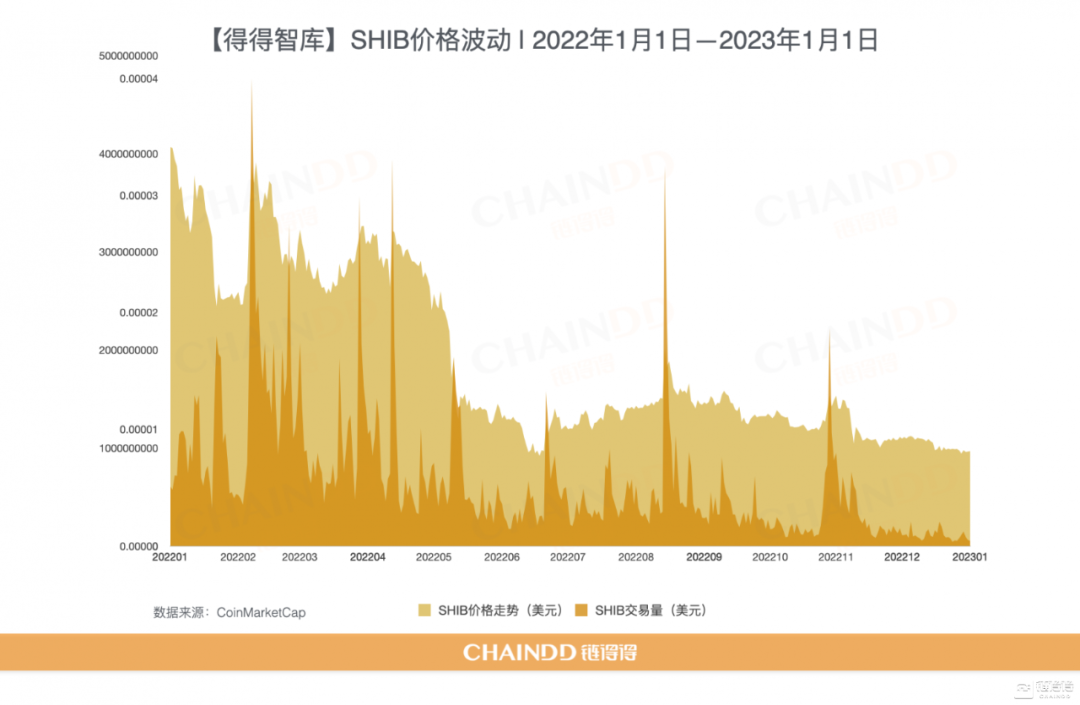
As another prominent meme coin, SHIB delivered a relatively stable performance in 2022, largely moving in line with the broader market without any major rallies or crashes. Its yearly high was $0.00003414, while the low touched $0.000007721.
—3—
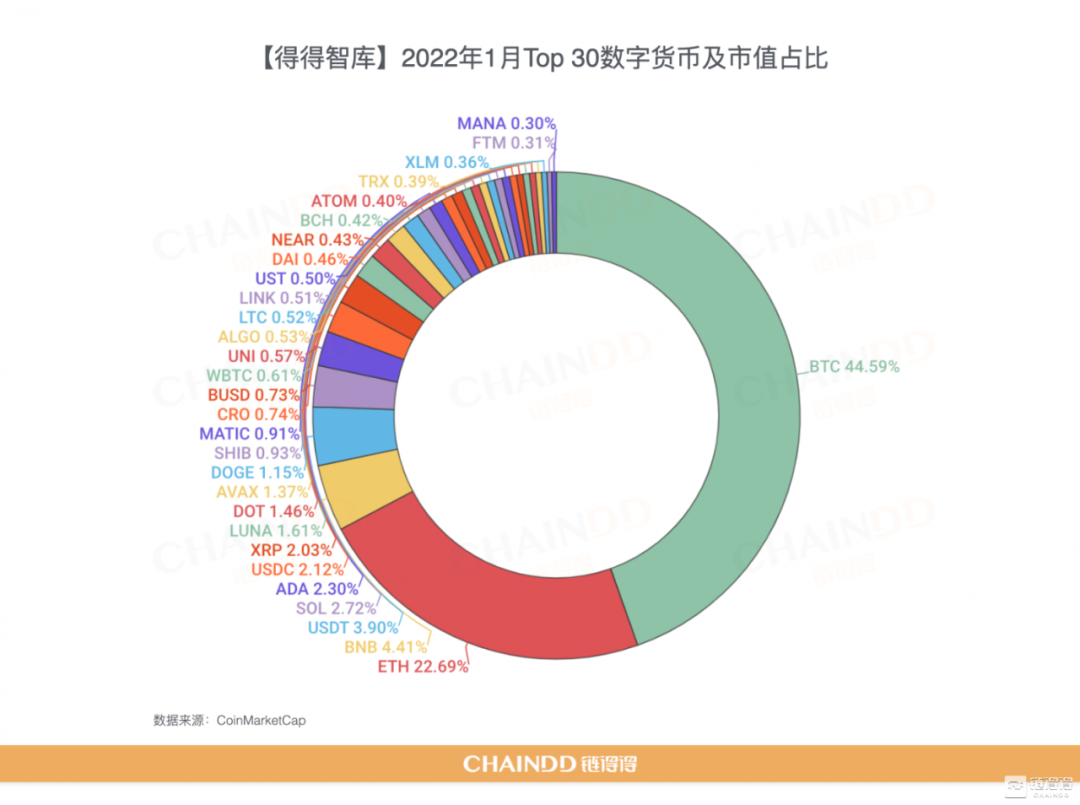
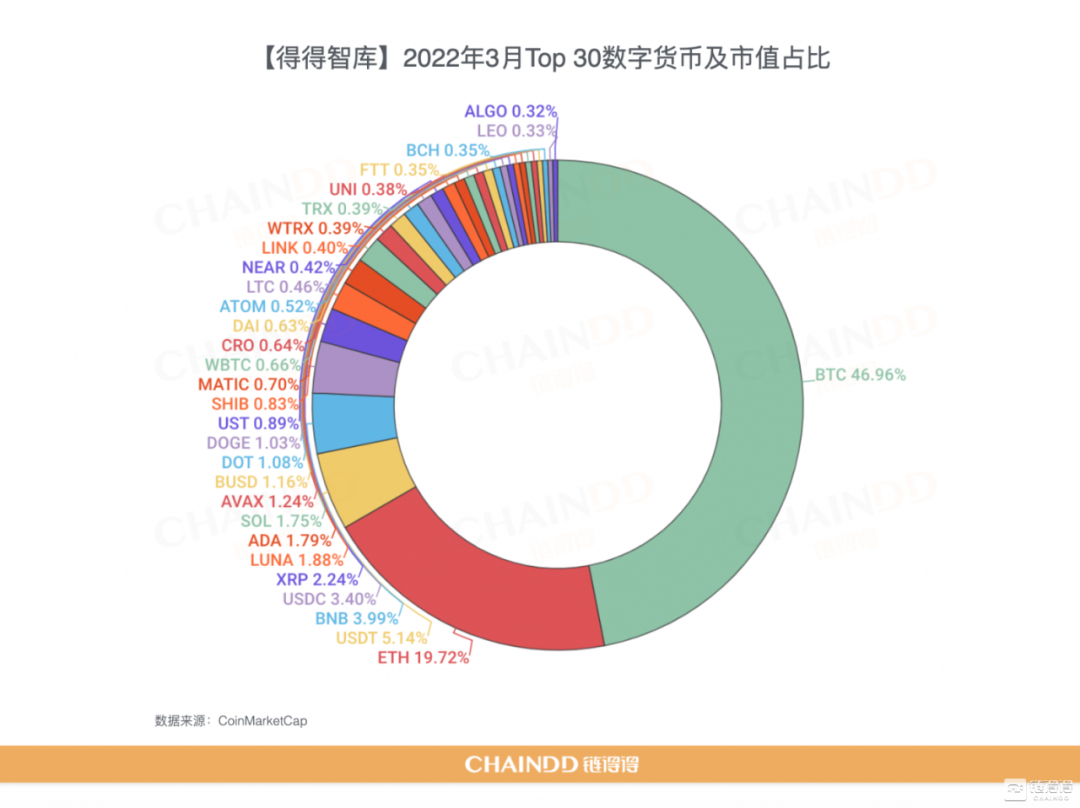
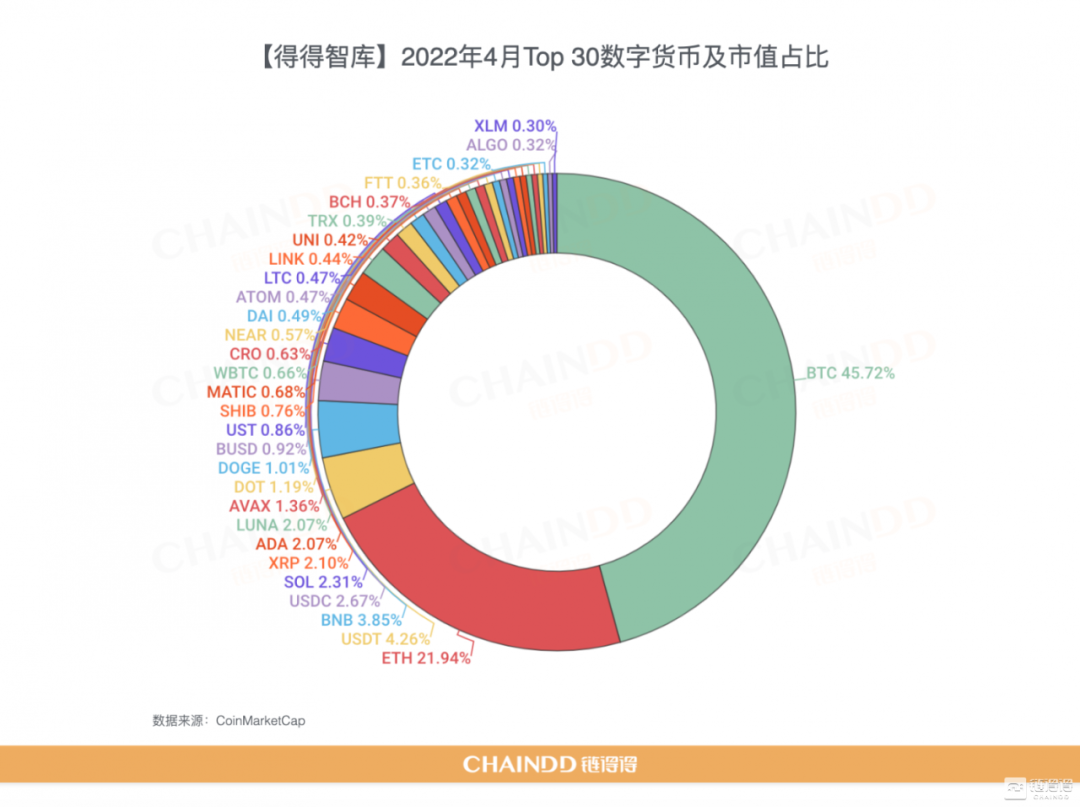
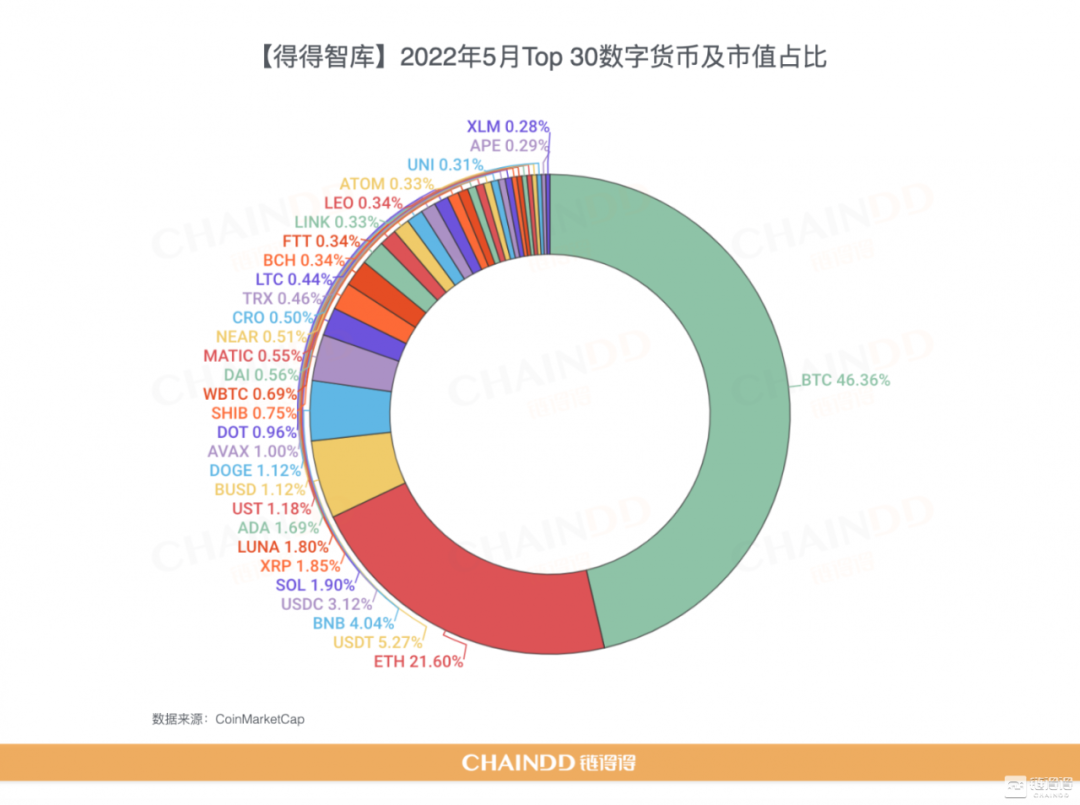
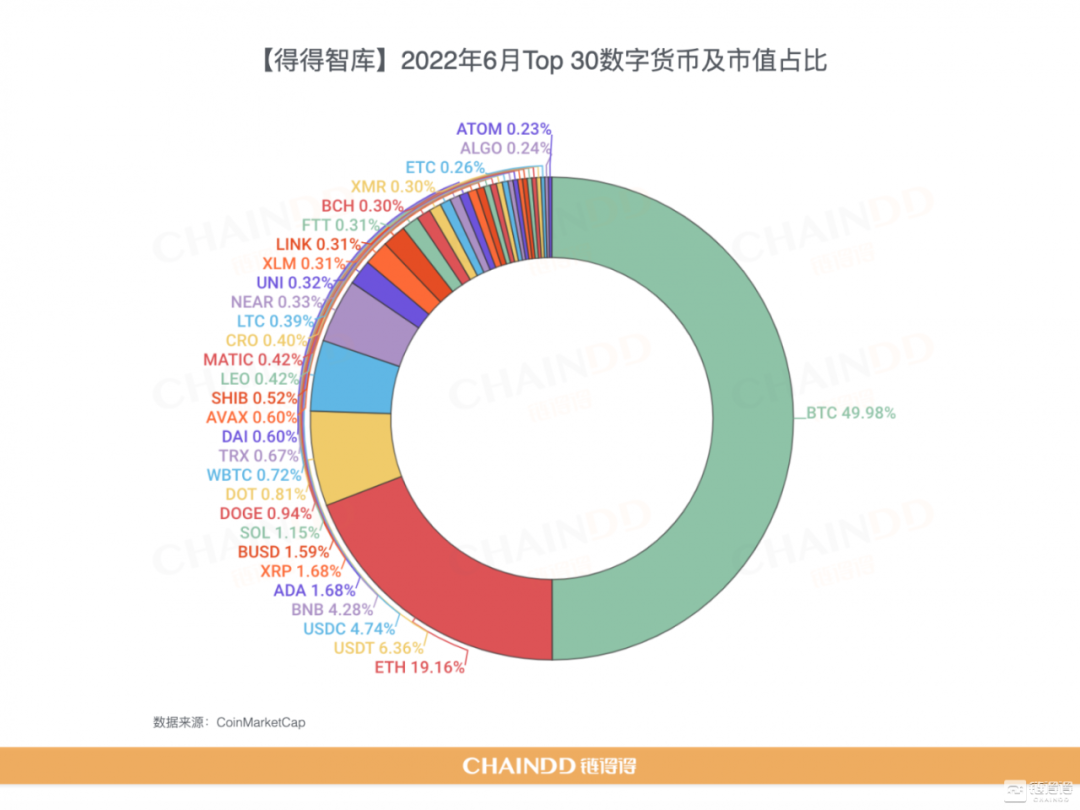
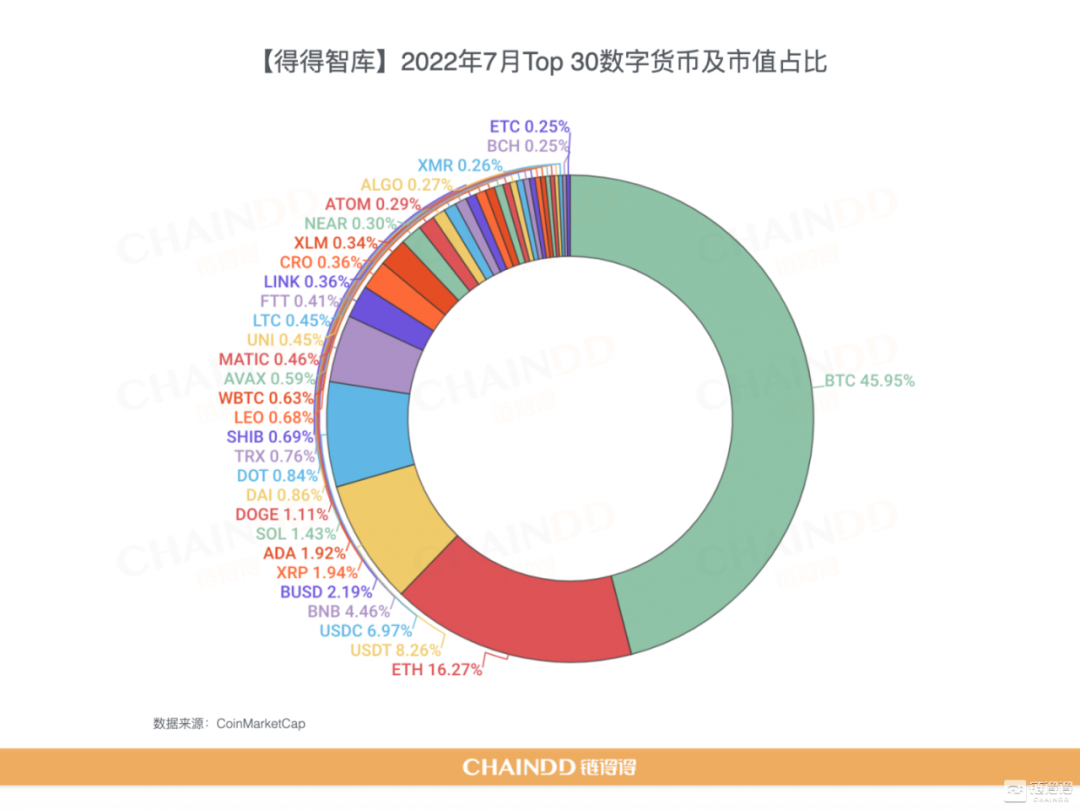
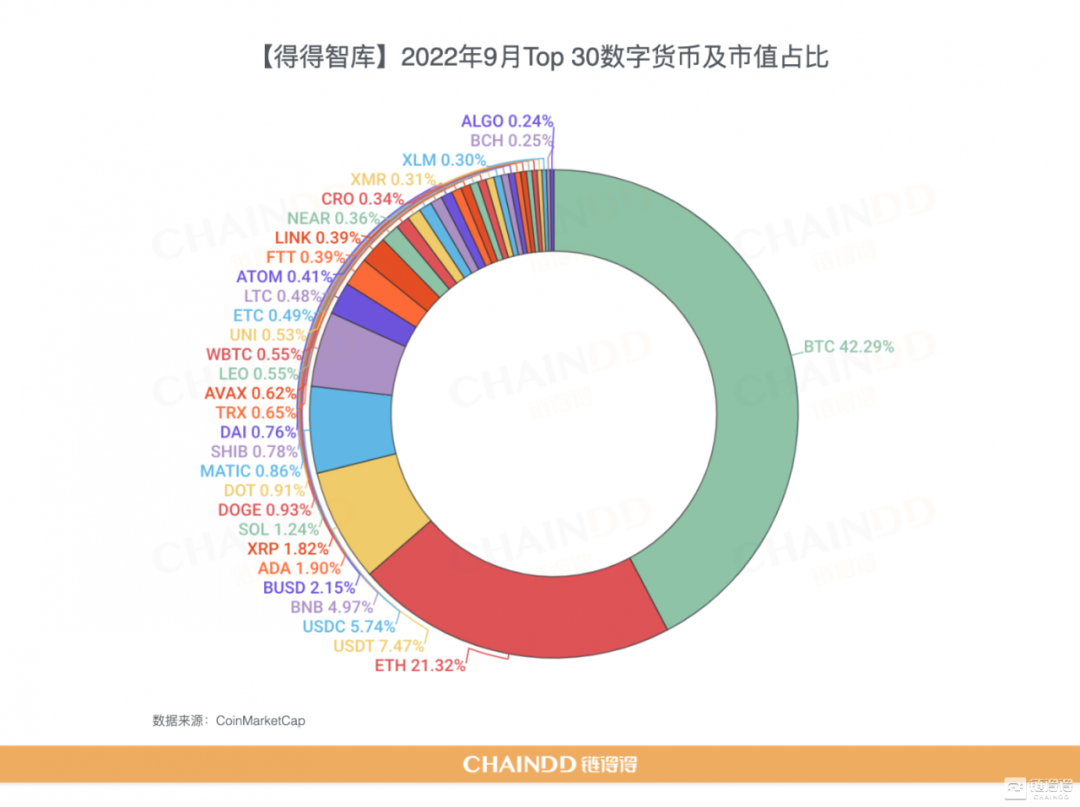
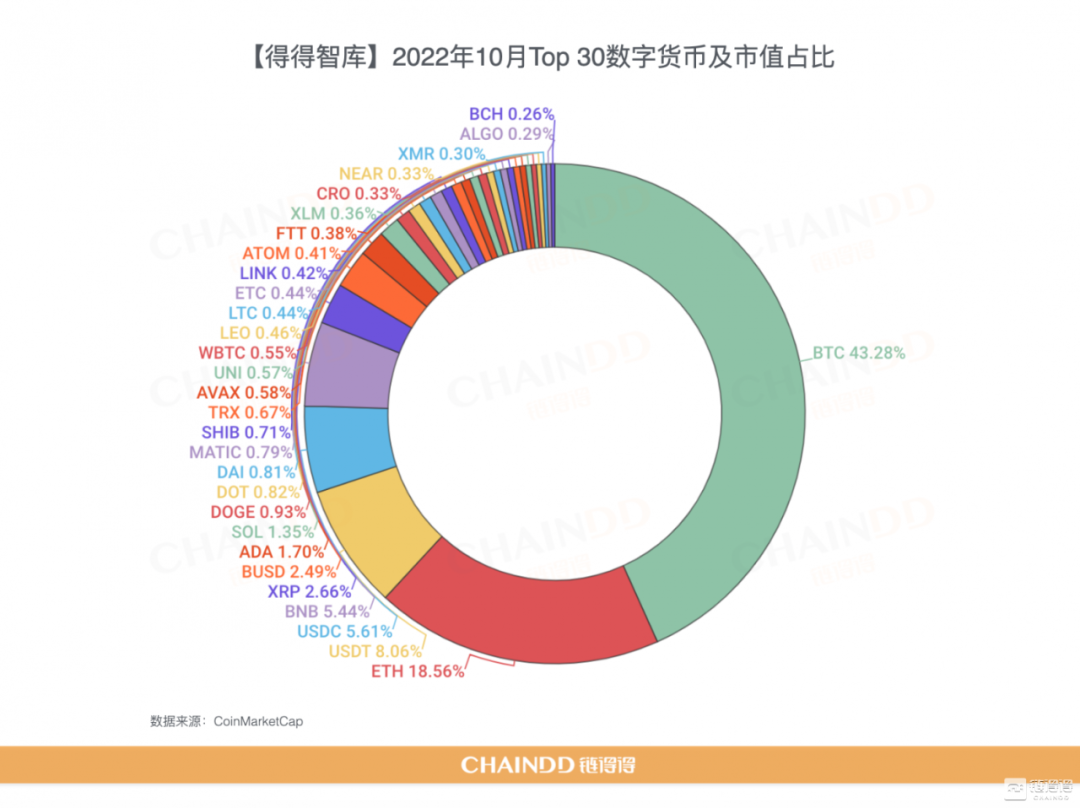
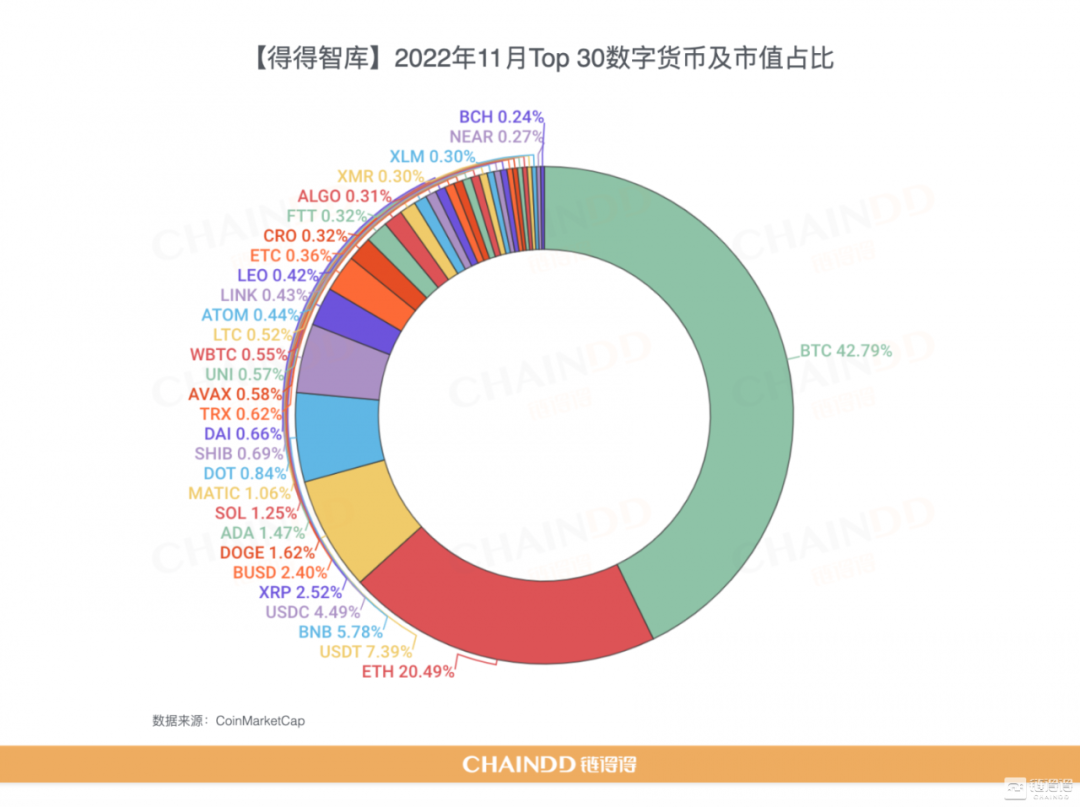
2022 Cryptocurrency Market Cap Top 30 Review
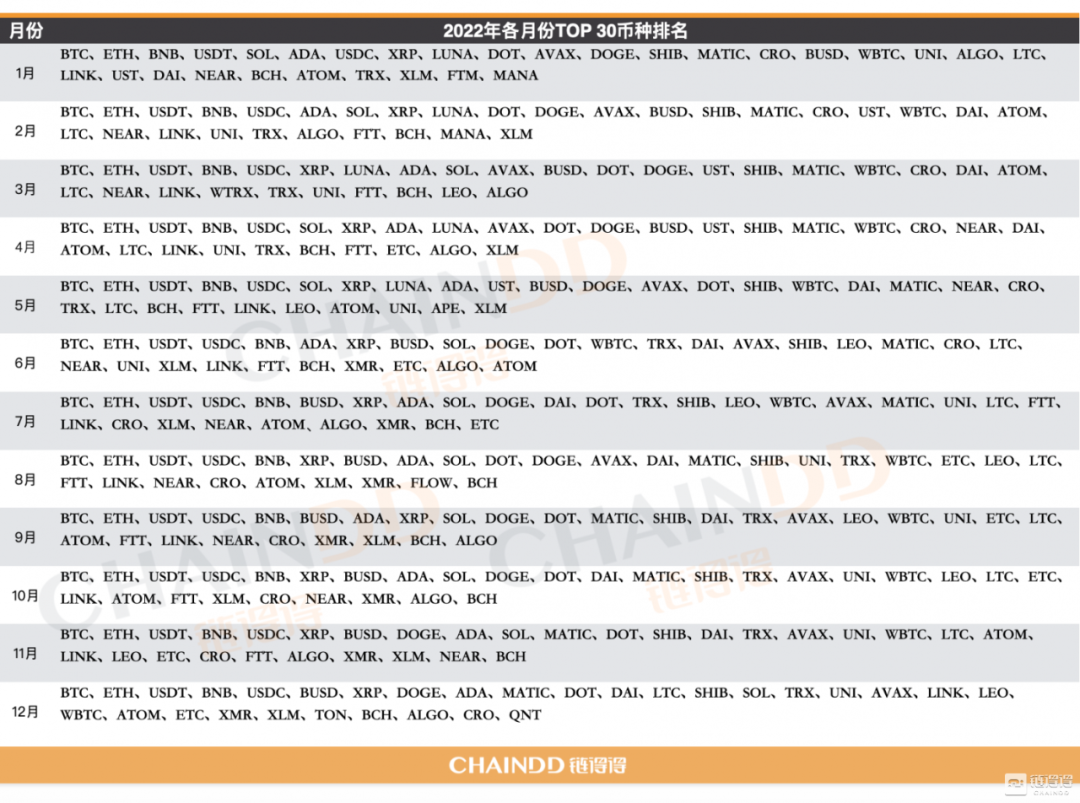
As the chart shows, BTC and ETH held firmly to the top two spots by market cap. BNB jumped to third place in January and remained a fixture in the Top 5 for the rest of the year.
Throughout the year, public blockchains and stablecoins continued to dominate the Top 30 rankings. Among public chains, LUNA fell out of the Top 30 following the Terra collapse in June, while SOL's ranking slipped in December after the FTX bankruptcy. In the stablecoin category, USDT maintained its lead as the largest centralized stablecoin by market cap, trailed closely by USDC and BUSD. The algorithmic stablecoin UST, like LUNA, vanished completely from the Top 30. DAI remained the only decentralized stablecoin to keep a Top 30 market cap.
Unlike 2021, tokens linked to DeFi and NFTs were scarce in this year's Top 30. MANA was a brief exception, entering at #30 in January on the tailwinds of the previous year's NFT boom and climbing to #29 in February before dropping out entirely.
The two leading meme coins, DOGE and SHIB, saw little movement in their market cap rankings.
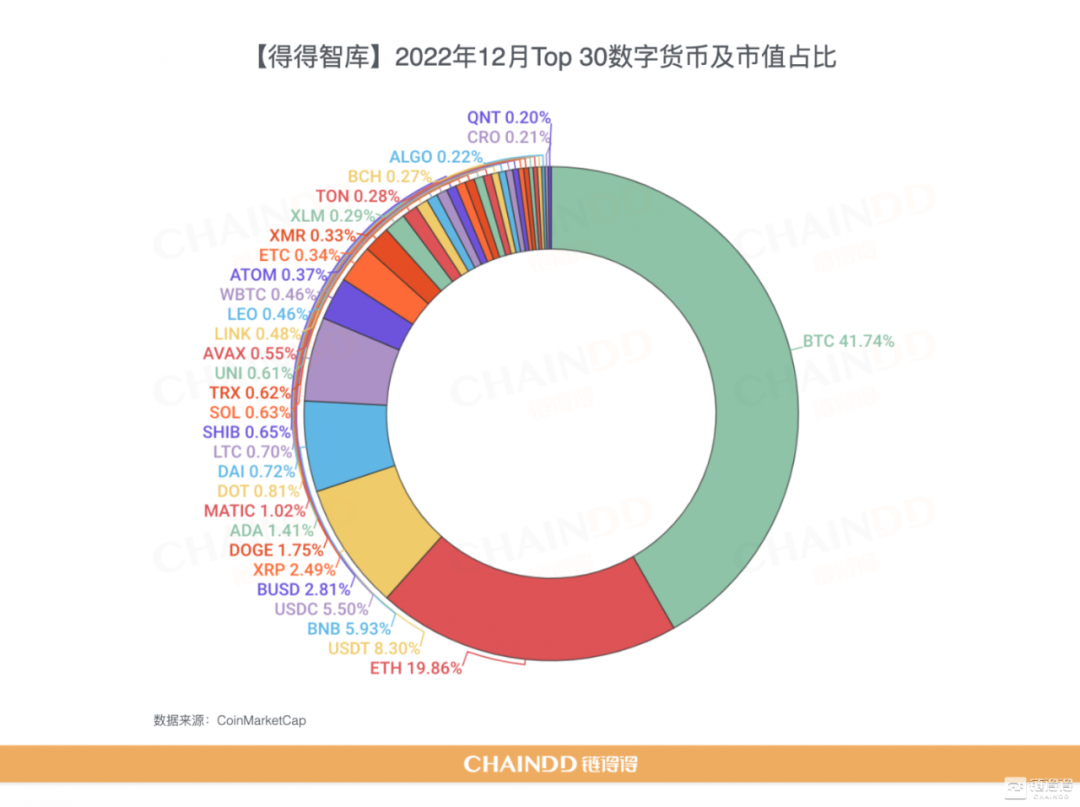
Below are the monthly Top 30 cryptocurrencies along with their respective market share percentages:


The content provided by ChainDD is for informational purposes only and should not be considered investment advice.